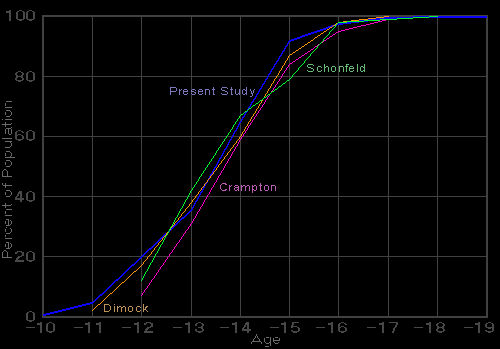
Table 15. Comparisons of data obtained in four studies on pubic hair development |
AGE | Percent of Boys Beginning Pubic Hair Development | |||||||
Crampton 1908 | Dimock 1937 | Schonfeld 1943 |
Present Study | |||||
% |
Cumu- lated % | % |
Cumu- lated % | % |
Cumu- lated % | % |
Cumu- lated % | |
9-10 | 0.2 | 0.2 | ||||||
10-11 | 2.0 | 2.0 | 2.0 | 2.2 | ||||
11-12 | 7.0 | 7.0 | 15.0 | 17.0 | 12.0 | 12.0 | 7.7 | 9.9 |
12-13 | 24.0 | 31.0 | 21.0 | 38.0 | 30.0 | 42.0 | 25.5 | 35.4 |
13-14 | 28.0 | 59.0 | 22.0 | 60.0 | 25.0 | 67.0 | 33.5 | 68.9 |
14-15 | 25.0 | 84.0 | 27.0 | 87.0 | 12.0 | 79.0 | 22.8 | 91.7 |
15-16 | 11.0 | 95.0 | 11.0 | 98.0 | 19.0 | 98.0 | 5.5 | 97.2 |
16-17 | 4.0 | 99.0 | 2.0 | 100.0 | 1.0 | 99.0 | 2.0 | 99.2 |
17-18 | 1.0 | 100.0 | 1.0 | 100.0 | 0.7 | 99.9 | ||
18-19 | 99.9 | |||||||
19-20 | 99.9 | |||||||
20-21 | 0.1 | 100.0 | ||||||
Cases | 3835 | 1406 | 1475 | 2511 | ||||
Mean | 13.44 ± 1.51 | 13.08 | 13.45 ± 0.03 | |||||
Median | 13.17 | 13.43 | ||||||
The data from the Crampton, Dimock, and Schonfeld studies | ||||||||
Figure 15. Comparison of memory with observational data | ||||||||
Record for age of onset of growth of pubic hair. |
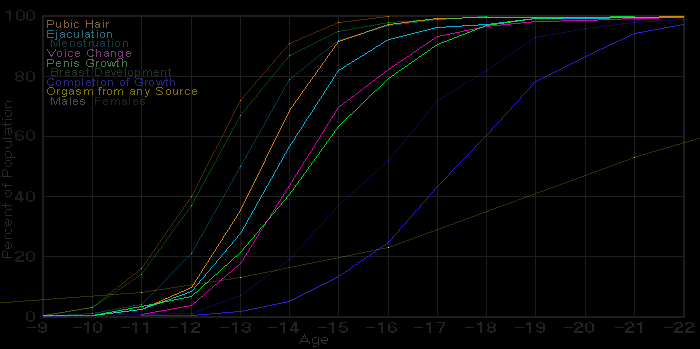
Tables 35, 19f. Adolescent physical development in the male and the female |
Adolescent Physical Development Beginning and Cumulated Percents | |||||||||||||||||||||
AGE | Pubic Hair |
First Ejaculation |
Menstruation | Orgasm from Any Source |
Voice Change |
Body/Penis Growth |
Breast Development |
Completion of Growth |
AGE | ||||||||||||
Begin. % |
Cumul. % |
Begin. % |
Cumul. % |
Begin. % |
Cumul. % |
Begin. % |
Cumul. % |
Begin. % |
Cumul. % |
Begin. % |
Cumul. % |
Begin. % |
Cumul. % |
Begin. % |
Cumul. % |
Begin. % |
Cumul. % |
Begin. % |
Cumul. % | ||
Boys | Girls | Boys | Girls | Girls | Boys | Boys | Girls | Boys | Girls | ||||||||||||
8-9 | 0.1 | 0.1 | 0.1 | 0.1 | 8-9 | ||||||||||||||||
9-10 | 0.2 | 0.2 | 3 | 3 | 0.2 | 0.3 | 1 | 1 | 6 | 8 | 0.0 | 0.1 | 3 | 3 | 9-10 | ||||||
10-11 | 2.0 | 2.2 | 13 | 16 | 1.8 | 2.1 | 3 | 4 | 0.6 | 0.6 | 3.0 | 3.1 | 11 | 14 | 0.1 | 0.1 | 10-11 | ||||
11-12 | 7.7 | 9.9 | 24 | 40 | 6.1 | 8.2 | 17 | 21 | 5 | 13 | 2.9 | 3.5 | 3.8 | 6.9 | 23 | 37 | 0.2 | 0.3 | 1 | 1 | 11-12 |
12-13 | 25.5 | 35.4 | 32 | 72 | 19.5 | 27.7 | 29 | 50 | 14.0 | 17.5 | 14.3 | 21.2 | 30 | 67 | 1.3 | 1.6 | 6 | 7 | 12-13 | ||
13-14 | 33.5 | 68.9 | 19 | 91 | 29.2 | 56.9 | 29 | 79 | 26.4 | 43.9 | 19.4 | 40.6 | 20 | 87 | 3.4 | 5.0 | 12 | 19 | 13-14 | ||
14-15 | 22.8 | 91.7 | 7 | 98 | 25.1 | 82.0 | 13 | 92 | 10 | 23 | 26.0 | 69.9 | 22.7 | 63.3 | 8 | 95 | 8.2 | 13.2 | 18 | 37 | 14-15 |
15-16 | 5.5 | 97.2 | 2 | 100 | 10.2 | 92.2 | 5 | 97 | 14.3 | 84.2 | 15.9 | 79.2 | 3 | 98 | 11.5 | 24.7 | 15 | 52 | 15-16 | ||
16-17 | 2.0 | 99.2 | 4.2 | 96.4 | 2 | 99 | 9.1 | 93.3 | 11.4 | 90.6 | 1 | 99 | 18.6 | 43.3 | 20 | 72 | 16-17 | ||||
17-18 | 0.7 | 99.9 | 1.8 | 98.2 | 1 | 100 | 3.3 | 96.6 | 6.4 | 97.0 | 1 | 100 | 17.1 | 60.4 | 10 | 82 | 17-18 | ||||
18-19 | 99.9 | 0.8 | 99.0 | 1.6 | 98.2 | 2.3 | 99.3 | 17.9 | 78.3 | 11 | 93 | 18-19 | |||||||||
19-20 | 99.9 | 0.4 | 99.4 | 30 | 53 | 0.7 | 98.9 | 0.5 | 99.8 | 8.4 | 86.7 | 3 | 96 | 19-20 | |||||||
20-21 | 0.1 | 100.0 | 0.1 | 99.5 | 0.4 | 99.3 | 0.2 | 100.0 | 7.5 | 94.2 | 2 | 98 | 20-21 | ||||||||
21-22 | 0.1 | 99.7 | 0.3 | 99.6 | 3.1 | 97.3 | 1 | 99 | 21-22 | ||||||||||||
22-23 | 0.1 | 99.8 | 0.3 | 99.9 | 1.8 | 99.1 | 1 | 100 | 22-23 | ||||||||||||
23-24 | 0.1 | 99.9 | 99.9 | 0.4 | 99.5 | 23-24 | |||||||||||||||
24-25 | 0.1 | 100.0 | 0.1 | 100.0 | 0.2 | 99.7 | 24-25 | ||||||||||||||
25-26 | 24 | 77 | 0.2 | 100.0 | 25-26 | ||||||||||||||||
Cases | 2511 | 3850 | 3573 | 5770 | 5873 | 2279 | 1355 | 5081 | 2621 | 1038 | Cases | ||||||||||
Mean Age | 13.45 | 12.3 | 13.88 | 13.1 | 21.2 | 14.44 | 14.49 | 12.5 | 17.47 | 16.0 | Mean Age | ||||||||||
Median Age | 13.43 | 12.3 | 13.77 | 13.0 | 20.0 | 14.23 | 14.42 | 12.4 | 17.40 | 15.9 | Median Age | ||||||||||
Ages shown (e.g., 8-9) include the lower limit (e.g., 8), and extend to, but do not include, the upper limit (e.g., 9). |
Figures 27, 7f, 8f. Cumulated percents: adolescent physical development in the male and the female. |
Data for males in more bright colors. |
Table 36. Adolescent developments |
School Grade |
No. of Boys Beginning Adolescence |
% of Boys Beginning Adolescence |
Cumulated % Adolescent at End of Grade |
1 | 6 | 0.16 | 0.16 |
2 | 14 | 0.38 | 0.54 |
3 | 42 | 1.13 | 1.67 |
4 | 82 | 2.20 | 3.87 |
5 | 180 | 4.83 | 8.70 |
6 | 409 | 10.96 | 19.66 |
7 | 667 | 17.88 | 37.54 |
8 | 959 | 25.71 | 63.25 |
9 | 863 | 23.14 | 86.39 |
10 | 376 | 10.08 | 96.47 |
11 | 96 | 2.57 | 99.04 |
12 | 24 | 0.64 | 99.68 |
13 | 11 | 0.29 | 99.97 |
14 | 1 | 0.03 | 100.00 |
Total | 3730 | 100.00 | 100.00 |
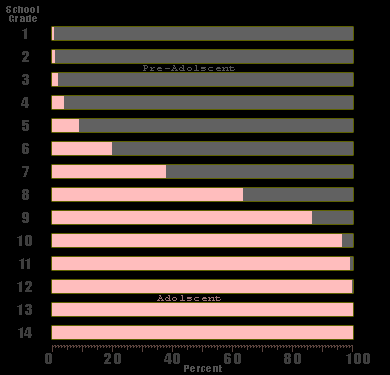
Mean grade at onset of adolescence: 8.33 0.028 Median grade at onset of adolescence: 8.49 | |||
Most of the boys reaching adolescence in the lowest grades | |||
| |||
Figure 28. Percent of adolescent boys in each school grade. |
Table 37. Ages at onset of adolescence |
Ages at Onset of Adolescence | |||||||||
AGE |
Educational Level |
Educational Level |
Educational Level | ||||||
Cases |
% of |
Cumu- |
Cases |
% of |
Cumu- |
Cases |
% of |
Cumu- | |
8-9 |
1 |
0.2 |
0.2 |
2 |
0.1 |
0.1 | |||
9-10 |
1 |
0.1 |
0.1 |
2 |
0.3 |
0.5 |
7 |
0.3 |
0.4 |
10-11 |
7 |
0.9 |
1.0 |
11 |
1.8 |
2.3 |
70 |
2.5 |
2.9 |
11-12 |
22 |
2.9 |
3.9 |
32 |
5.2 |
7.5 |
221 |
7.8 |
10.7 |
12-13 |
104 |
13.6 |
17.5 |
123 |
19.9 |
27.4 |
707 |
25.1 |
35.8 |
13-14 |
185 |
24.1 |
41.6 |
189 |
30.5 |
57.9 |
980 |
34.8 |
70.6 |
14-15 |
275 |
35.8 |
77.4 |
205 |
33.0 |
90.9 |
647 |
23.0 |
93.6 |
15-16 |
137 |
17.8 |
95.2 |
39 |
6.3 |
97.2 |
126 |
4.5 |
98.1 |
16-17 |
31 |
4.0 |
99.2 |
13 |
2.1 |
99.3 |
37 |
1.3 |
99.4 |
17-18 |
5 |
0.7 |
99.9 |
3 |
0.5 |
99.8 |
15 |
0.5 |
99.9 |
18-19 |
1 |
0.1 |
100.0 |
1 |
0.2 |
100.0 |
2 |
0.1 |
100.0 |
19-20 |
1 |
— |
100.0 | ||||||
Total |
768 |
100.0 |
619 |
100.0 |
2815 |
100.0 | |||
Mean |
14.14 ± 0.044 |
13.67 ± 0.049 |
13.39 ± 0.023 | ||||||
Median |
14.24 years |
13.75 years |
13.41 years |
Age |
Total Sample Population |
Corrected for U. S. Population | |||
Cases |
% of |
Cumulated |
% of |
Cumulated | |
8 |
3 |
0.1 |
0.1 |
0.1 |
0.1 |
9 |
10 |
0.2 |
0.3 |
0.2 |
0.4 |
10 |
93 |
2.0 |
2.3 |
1.6 |
2.0 |
11 |
304 |
6.6 |
8.9 |
4.9 |
6.9 |
12 |
1035 |
22.5 |
31.4 |
18.7 |
25.6 |
13 |
1507 |
32.8 |
64.2 |
29.1 |
54.7 |
14 |
1209 |
26.3 |
90.5 |
32.4 |
87.1 |
15 |
316 |
6.9 |
97.4 |
9.6 |
96.7 |
16 |
85 |
1.9 |
99.3 |
2.6 |
99.3 |
17 |
23 |
0.5 |
99.8 |
0.6 |
99.9 |
18 |
4 |
0.1 |
99.9 |
0.2 |
100.0 |
19 |
1 |
0,1 |
100.0 |
— |
100.0 |
Total |
4590 |
100.0 |
100.0 | ||
Mean |
13.55 ± 0.018 | ||||
Median |
13.56 years | ||||
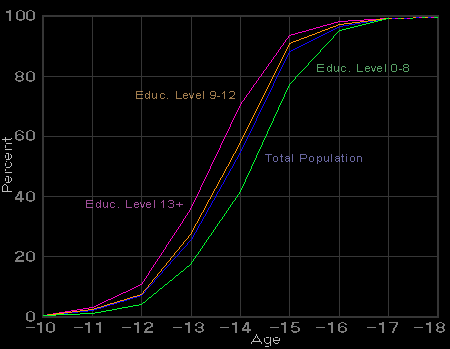
Comparing development for three groups
defined in accordance with the years of schooling ultimately attained: -- “Educ. level 0-8” are the males who never go beyond grade school. -- “Educ. level 9-12” are the males who enter high school but never go beyond. -- “Educ. level 13+” are the males who will ultimately go to college. | |||||
Figures for the U. S. population are based on the figures for the sample population corrected for the educational distribution shown in the U. S. Census for 1940. | |||||
| |||||
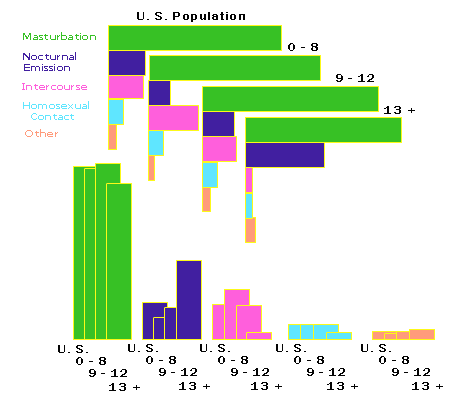
Figure 29. Age at onset of adolescence, by three educational levels. Curve for total population, on the basis of the U. S. Correction, is shown in the blue line. |
Table 38. Sources of first ejaculation |
Source | Number of
Adolescent Males |
Percent of Population | |||||||
Popu- lat. in Sample |
Educ. Level 0-8 |
Educ. Level 9-12 |
Educ. Level 13+ |
Popu- lat. in Sample |
Educ. Level 0-8 |
Educ. Level 9-12 |
Educ. Level 13+ |
Total U. S. Popu- lation 1 | |
No Ejaculation | 14 | 4 | 2 | 3 | 0.4 | 0.6 | 0.4 | 0.1 | 0.42 |
Masturbation | 2378 | 455 | 346 | 1293 | 66.2 | 68.2 | 70.1 | 62.2 | 68.39 |
Noct. Emiss. | 798 | 47 | 58 | 654 | 22.2 | 7.1 | 11.7 | 31.4 | 13.11 |
Petting | 13 | 2 | 2 | 9 | 0.4 | 0.3 | 0.4 | 0.4 | 0.37 |
Coitus | 222 | 123 | 60 | 29 | 6.2 | 18.5 | 12.1 | 1.4 | 12.53 |
Homosexual | 103 | 32 | 23 | 39 | 2.9 | 4.8 | 4.7 | 1.9 | 4.33 |
Animal Coitus | 6 | 0 | 0 | 6 | 0.2 | 0.0 | 0.0 | 0.3 | 0.04 |
Spontaneous | 54 | 3 | 3 | 48 | 1.5 | 0.5 | 0.6 | 2.3 | 0.81 |
Total | 3588 | 666 | 494 | 2081 | 100.0 | 100.0 | 100.0 | 100.0 | 100.00 |
“Educ. level 0-8” are the males who never go beyond grade school. “Educ. level 9-12” are the males who enter high school but never go beyond. “Educ. level 13+” are the males who will ultimately go to college. | |||||||||
1 The final column shows percent involved | |||||||||
Figure 30. Sources of first ejaculation | |||||||||
Calculated for total population corrected for U. S. Census distribution, and for boys |
Sources of First Spontaneous Ejaculation |
Chiefly Physical Stimulation | |
Sitting at desk Sitting in classroom Lying still on floor Lying still in bed Urination At toilet General stimulation in bath Moving water in bath General stimulation with towel General skin irritation Vibration of a boat |
Sliding on chair Sliding down a bannister Tension in gymnastics Chinning on bar Climbing tree, pole or rope (A rather common source) Wrestling with female Wrestling with male Riding an automobile Tight clothing |
Chiefly Emotional Stimulation | |
Day dreaming Reading a book Walking down a street In vaudeville In movies Kissed by female Watching petting Peeping at nude female Sex discussion at YMCA |
Milking a cow When scared at night When bicycle was stolen A bell ringing An exciting basketball game Trying to finish an examination in school Reciting in front of class Injury in a car wreck |