 |
|
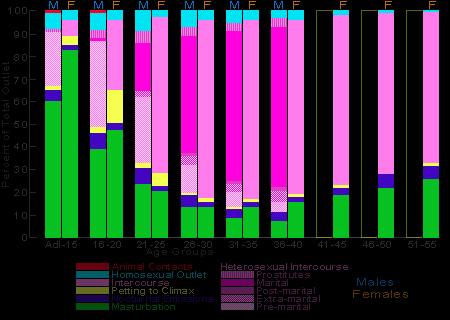
Figures 126-127.
Sources of orgasm for total active U. S. population, by age groups |
|
|
|
Figures 110f-112f.
Percentage of total outlet: sources of orgasm, |
|
|
|
Figures 113f-115f.
Percentage of total outlet: sources of orgasm, |
 |
|
Figures 126-127.
Sources of orgasm for total active U. S. population, by age groups |
|
|
|
Figures 110f-112f.
Percentage of total outlet: sources of orgasm, |
|
|
|
Figures 113f-115f.
Percentage of total outlet: sources of orgasm, |
|
|
|
Figures 128-133.
Sources of orgasm for single and married males |
|
Summary data, corrected for distribution of
age, marital status, and educational level |