| Masturbation by Educational Level | |||||||||||||||||
| Males | Females | ||||||||||||||||
|
Age at Adol. |
Cases | Single Males | Age During Activity |
Age at Adol. |
Single Females | Married Females | |||||||||||
| Total Population | Indices, Total Populations |
Active Population | |||||||||||||||
| Mean Frequency |
Me- dian Freq. |
%of Total Outlet |
By Means % |
By Me- dians % |
Active Incid. % |
Mean Frequency |
Me- dian Freq |
Active Incid. % | % of Total Outlet | Cases in Total Sample |
Active Incid. % | % of Total Outlet | Cases in Total Sample | ||||
| Educ. level 0-8 -- Activity between adol.-15 | |||||||||||||||||
| 8-12 | 131 | 2.65 ± 0.25 | 1.70 | 53.0 | 230 | 284 | 96.9 | 2.73 ± 0.25 | 1.76 | Adol.-15 | 8-11 | 21 | 76 | 1203 | |||
| 13 | 180 | 1.71 ± 0.16 | 1.01 | 53.8 | 149 | 168 | 91.7 | 1.87 ± 0.17 | 1.19 | 12 | 18 | 90 | 1684 | ||||
| 14 | 270 | 1.25 ± 0.11 | 0.60 | 53.7 | 109 | 100 | 80.4 | 1.55 ± 0.12 | 0.94 | 13 | 20 | 86 | 1747 | ||||
| 15+ | 115 | 1.15 ± 0.14 | 0.60 | 58.0 | 100 | 100 | 79.1 | 1.45 ± 0.16 | 0.90 | 14 | 21 | 86 | 796 | ||||
| Educ. level 0-8 -- Activity between 16-20 | 15 + | 17 | 83 | 262 | |||||||||||||
| 8-12 | 114 | 1.47 ± 0.18 | 0.77 | 28.3 | 179 | 197 | 91.2 | 1.61 ± 0.19 | 0.92 | 16-20 | 8-11 | 32 | 56 | 1166 | 24 | 7 | 139 |
| 13 | 165 | 0.96 ± 0.09 | 0.50 | 31.1 | 117 | 128 | 86.1 | 1.11 ± 0.10 | 0.71 | 12 | 27 | 60 | 1638 | 24 | 9 | 153 | |
| 14 | 266 | 0.82 ± 0.07 | 0.39 | 31.9 | 100 | 100 | 82.3 | 1.00 ± 0.08 | 0.53 | 13 | 26 | 60 | 1700 | 25 | 10 | 169 | |
| 15+ | 154 | 0.89 ± 0.09 | 0.47 | 40.0 | 109 | 120 | 89.0 | 1.00 ± 0.10 | 0.58 | 14 | 29 | 61 | 777 | 21 | 3 | 76 | |
| Educ. level 9-12 -- Activity between adol.-15 | 15 + | 25 | 71 | 345 | |||||||||||||
| 8-12 | 170 | 2.32 ± 0.17 | 1.64 | 58.2 | 157 | 132 | 97.1 | 2.39 ± 0.17 | 1.72 | 21-25 | 8-11 | 39 | 43 | 526 | 29 | 7 | 333 |
| 13 | 197 | 2.10 ± 0.19 | 1.21 | 60.6 | 142 | 115 | 91.9 | 2.28 ± 0.20 | 1.38 | 12 | 34 | 48 | 769 | 26 | 6 | 458 | |
| 14 | 213 | 1.62 ± 0.12 | 1.06 | 66.0 | 109 | 101 | 85.0 | 1.91 ± 0.13 | 1.38 | 13 | 34 | 48 | 851 | 28 | 7 | 487 | |
| 15+ | 42 | 1.48 ± 0.26 | 1.05 | 59.3 | 100 | 100 | 83.3 | 1.77 ± 0.28 | 1.40 | 14 | 32 | 45 | 460 | 25 | 4 | 254 | |
| Educ. level 9-12 -- Activity between 16-20 | 15 + | 32 | 34 | 203 | 22 | 8 | 121 | ||||||||||
| 8-12 | 162 | 1.37 ± 0.11 | 0.80 | 34.9 | 120 | 154 | 92.0 | 1.49 ± 0.12 | 0.91 | 26-30 | 8-11 | 44 | 31 | 196 | 31 | 7 | 286 |
| 13 | 196 | 1.45 ± 0.17 | 0.74 | 41.1 | 127 | 142 | 90.3 | 1.60 ± 0.19 | 0.88 | 12 | 39 | 37 | 266 | 31 | 6 | 426 | |
| 14 | 207 | 1.14 ± 0.10 | 0.52 | 42.5 | 100 | 100 | 84.5 | 1.34 ± 0.11 | 0.77 | 13 | 46 | 54 | 323 | 33 | 7 | 527 | |
| 15+ | 58 | 1.34 ± 0.19 | 0.87 | 44.4 | 117 | 167 | 94.8 | 1.42 ± 0.19 | 0.92 | 14 | 40 | 34 | 192 | 29 | 6 | 275 | |
| Educ. level 13+ -- Activity between adol.-15 | 15 + | 44 | 48 | 87 | 31 | 11 | 147 | ||||||||||
| 8-12 | 893 | 2.61 ± 0.09 | 1.98 | 79.7 | 175 | 194 | 90.3 | 2.89 ± 0.10 | 2.24 | 31-35 | 8-11 | 54 | 32 | 99 | 36 | 8 | 185 |
| 13 | 896 | 2.15 ± 0.08 | 1.59 | 78.8 | 144 | 159 | 83.4 | 2.58 ± 0.08 | 2.01 | 12 | 46 | 30 | 122 | 35 | 7 | 291 | |
| 14 | 600 | 1.67 ± 0.09 | 1.02 | 78.6 | 112 | 100 | 73.2 | 2.29 ± 0.10 | 1.82 | 13 | 49 | 60 | 162 | 36 | 8 | 415 | |
| 15+ | 114 | 1.49 ± 0.19 | 1.02 | 80.9 | 100 | 100 | 60.5 | 2.46 ± 0.25 | 1.93 | 14 | 49 | 36 | 109 | 30 | 7 | 224 | |
| Educ. level 13 + -- Activity between 16-20 | 15 + | 34 | 12 | 131 | |||||||||||||
| 8-12 | 893 | 2.02 ± 0.08 | 1.43 | 67.2 | 142 | 164 | 91.8 | 2.20 ± 0.08 | 1.63 | 36-40 | 8-11 | 60 | 25 | 65 | 40 | 7 | 133 |
| 13 | 896 | 1.66 ± 0.06 | 1.08 | 65.4 | 117 | 124 | 88.6 | 1.88 ± 0.06 | 1.38 | 12 | 50 | 30 | 66 | 34 | 10 | 187 | |
| 14 | 600 | 1.45 ± 0.07 | 0.92 | 64.2 | 102 | 106 | 84.5 | 1.72 ± 0.07 | 1.31 | 13 | 50 | 63 | 96 | 36 | 10 | 270 | |
| 15+ | 170 | 1.42 ± 0.12 | 0.87 | 63.6 | 100 | 100 | 83.5 | 1.70 ± 0.13 | 1.23 | 14 | 60 | 29 | 62 | 33 | 10 | 168 | |
| Educ. level 13+ -- Activity between 21-25 | 15 + | 41 | 12 | 93 | |||||||||||||
| 8-12 | 561 | 1.46 ± 0.08 | 0.78 | 53.1 | 128 | 150 | 90.4 | 1.61 ± 0.08 | 0.92 | 41-45 | 8-11 | 38 | 10 | 78 | |||
| 13 | 566 | 1.18 ± 0.06 | 0.68 | 52.2 | 104 | 131 | 85.7 | 1.38 ± 0.07 | 0.85 | 12 | 32 | 9 | 102 | ||||
| 14 | 393 | 1.14 ± 0.07 | 0.52 | 53.2 | 100 | 100 | 82.7 | 1.37 ± 0.08 | 0.80 | 13 | 35 | 10 | 144 | ||||
| 15+ | 136 | 1.17 ± 0.13 | 0.55 | 53.0 | 103 | 106 | 81.6 | 1.43 ± 0.15 | 0.81 | 14 | 38 | 15 | 101 | ||||
| Educ. level 13+ -- Activity between 26-30 | 15 + | 35 | 11 | 71 | |||||||||||||
| 8-12 | 176 | 1.36 ± 0.17 | 0.58 | 49.8 | 137 | 132 | 89.8 | 1.52 ± 0.18 | 0.71 | ||||||||
| 13 | 179 | 0.99 ± 0.09 | 0.49 | 42.7 | 100 | 111 | 80.4 | 1.23 ± 0.10 | 0.78 | ||||||||
| 14 | 152 | 1.11 ± 0.13 | 0.44 | 52.9 | 112 | 100 | 82.2 | 1.35 ± 0.15 | 0.66 | ||||||||
 |
|
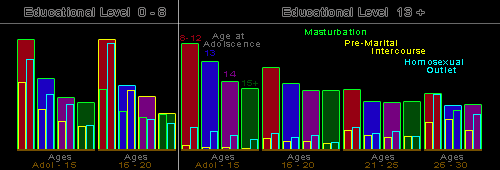
Figure 91. Relation of age at onset of adolescence to frequencies of masturbation, pre-marital intercourse with companions, and homosexual outlet |
|
Based on single males. Relative lengths of bars show mean frequencies for each adolescent group. Effects shown as continuing up to 10 years for a grade school group (0-8); and up to 20 years for a college group (13+). |
