|
Age Group | Paren- tal Occup. Class | Cases | Outlets and Parental Occupational Class Mean Frequencies, Total Population | ||||||
| Total Outlet | Mastur- bation | Nocturnal Emissions |
Petting to Climax | Coitus, Com- panions | Coitus, Pros- titutes | Homo- sexual | |||
| Subject: Occupational Class 3 | |||||||||
| Adol.-15 | 2 | 126 | 2.68 | 1.40 | 0.06 | 0.03 | 0.90 | 0.01 | 0.20 |
| 3 | 384 | 3.10 | 1.57 | 0.11 | 0.04 | 1.00 | 0.01 | 0.26 | |
| 4 | 107 | 3.62 | 1.94 | 0.07 | 0.04 | 1.17 | 0.01 | 0.31 | |
| 5 | 65 | 3.38 | 1.81 | 0.05 | 0.03 | 1.22 | 0.01 | 0.15 | |
| 16-20 | 2 | 116 | 3.46 | 1.01 | 0.16 | 0.04 | 1.90 | 0.16 | 0.21 |
| 3 | 318 | 3.50 | 1.00 | 0.21 | 0.07 | 1.76 | 0.17 | 0.22 | |
| 4 | 105 | 3.82 | 0.98 | 0.24 | 0.06 | 2.17 | 0.10 | 0.27 | |
| 5 | 64 | 3.03 | 0.88 | 0.14 | 0.05 | 1.52 | 0.11 | 0.23 | |
| Subject: Occupational Class 5 | |||||||||
| Adol.-15 | 3 | 205 | 2.85 | 2.07 | 0.27 | 0.03 | 0.22 | 0.01 | 0.16 |
| 4 | 304 | 3.00 | 2.18 | 0.28 | 0.03 | 0.29 | 0.003 | 0.16 | |
| 5 | 563 | 2.77 | 2.13 | 0.31 | 0.04 | 0.08 | 0.006 | 0.15 | |
| 6 | 98 | 3.76 | 2.74 | 0.20 | 0.03 | 0.21 | 0.005 | 0.45 | |
| 16-20 | 3 | 201 | 2.88 | 1.57 | 0.35 | 0.10 | 0.46 | 0.05 | 0.27 |
| 4 | 305 | 2.97 | 1.64 | 0.38 | 0.11 | 0.56 | 0.04 | 0.20 | |
| 5 | 516 | 2.63 | 1.68 | 0.37 | 0.14 | 0.25 | 0.03 | 0.14 | |
| 6 | 100 | 3.80 | 1.94 | 0.35 | 0.12 | 0.58 | 0.02 | 0.62 | |
| 21-25 | 3 | 124 | 2.73 | 1.09 | 0.31 | 0.11 | 0.65 | 0.07 | 0.43 |
| 4 | 183 | 2.86 | 1.17 | 0.35 | 0.14 | 0.78 | 0.06 | 0.32 | |
| 5 | 262 | 2.32 | 1.22 | 0.30 | 0.14 | 0.37 | 0.06 | 0.21 | |
| 6 | 71 | 3.13 | 1.27 | 0.31 | 0.21 | 0.53 | 0.03 | 0.67 | |
| Subject: Occupational Class 6 | |||||||||
| Adol.-15 | 4 | 109 | 2.85 | 2.18 | 0.33 | 0.04 | 0.03 | 0.003 | 0.22 |
| 5 | 228 | 2.86 | 2.17 | 0.43 | 0.04 | 0.06 | 0.001 | 0.09 | |
| 6 | 1048 | 2.86 | 2.29 | 0.28 | 0.05 | 0.09 | 0.005 | 0.08 | |
| 16-20 | 4 | 111 | 3.01 | 1.71 | 0.48 | 0.20 | 0.29 | 0.03 | 0.27 |
| 5 | 230 | 2.72 | 1.82 | 0.47 | 0.15 | 0.16 | 0.02 | 0.07 | |
| 6 | 1021 | 2.58 | 1.73 | 0.38 | 0.14 | 0.23 | 0.02 | 0.06 | |
| 21-25 | 4 | 98 | 2.55 | 1.10 | 0.46 | 0.27 | 0.44 | 0.03 | 0.27 |
| 5 | 178 | 2.56 | 1.43 | 0.43 | 0.21 | 0.32 | 0.01 | 0.10 | |
| 6 | 554 | 2.38 | 1.27 | 0.37 | 0.16 | 0.39 | 0.03 | 0.10 | |
| Subject: Occupational Class 7 | |||||||||
| Adol.-15 | 4 | 74 | 3.14 | 2.56 | 0.45 | 0.04 | 0.002 | 0.05 | |
| 5 | 152 | 2.70 | 2.05 | 0.43 | 0.06 | 0.01 | 0.0003 | 0.06 | |
| 6 | 244 | 3.00 | 2.24 | 0.44 | 0.02 | 0.12 | 0.001 | 0.10 | |
| 7 | 414 | 3.05 | 2.39 | 0.40 | 0.07 | 0.08 | 0.004 | 0.07 | |
| 16-20 | 4 | 75 | 3.23 | 2.21 | 0.55 | 0.12 | 0.30 | 0.01 | 0.03 |
| 5 | 155 | 2.50 | 1.60 | 0.47 | 0.17 | 0.20 | 0.02 | 0.04 | |
| 6 | 246 | 3.18 | 2.17 | 0.54 | 0.14 | 0.23 | 0.04 | 0.07 | |
| 7 | 416 | 3.04 | 2.12 | 0.43 | 0.18 | 0.23 | 0.02 | 0.03 | |
| 21-25 | 4 | 71 | 2.51 | 1.37 | 0.39 | 0.17 | 0.58 | 0.01 | 0.02 |
| 5 | 143 | 2.43 | 1.18 | 0.40 | 0.17 | 0.55 | 0.02 | 0.05 | |
| 6 | 236 | 2.88 | 1.38 | 0.43 | 0.23 | 0.71 | 0.08 | 0.01 | |
| 7 | 266 | 2.71 | 1.51 | 0.43 | 0.23 | 0.46 | 0.02 | 0.02 | |
|
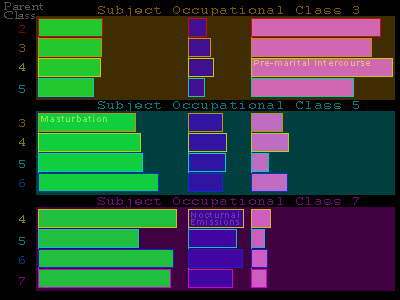
Emphasizing near identity of histories of subjects who reach the same occupational class, | |||||||||
 | |||||||||
|
Figure 124. Comparisons of sexual patterns of males of same occupational class but originating from diverse parental classes | |||||||||
|
Occupational Class: 0. Dependents 1. Underworld 2. Day labor 3. Semi-skilled labor 4. Skilled labor 5. Lower white collar group 6. Upper white collar group 7. Professional group 8. Business executive group 9. Extremely wealthy group | |||||||||
|
Comparing mean frequency data for the age period 16-20, | |||||||||