<< Frequency of Total Outlet >>

There are some individuals who derive 100 per cent of their outlet from a single kind of sexual activity. Most persons regularly depend upon two or more sources of outlet; and there are some who may include all six of them in some short period of time. The mean number of outlets utilized by our more than 5000 males is between 2 and 3 (means of 2.5 or 2.2) (Table 39).

Table 39. Number of sources of outlet in any 5-year period
No. of
Sources
Sample Population U. S. Population
Cases % of
Popula-

tion
Cumu-
lated

Percent
Cases
per

10,000
% Of
Popula-

tion
Cumu-
lated

Percent
0 263 2.2 100.0 199 1.99 100.00
1 2,169 18.4 97.8 2,579 25.79 98.01
2 3,834 32.4 79.4 3,314 33.14 72.22
3 3,478 29.5 47.0 2,742 27.42 39.08
4 1,690 14.3 17.5 974 9.74 11.66
5 342 2.9 3.2 179 1.79 1.92
6 33 0.3 0.3 13 0.13 0.13
Total 11,809   10,000  
Mean 2.45 ± 0.01 2.22
Median 2.91 2.67

Computed for the whole population involved in the present study,
and computed for a theoretic adult male population
with the age distribution found in the U. S. Census for 1940.


This number varies considerably with different age groups and with different social levels (Table 46).

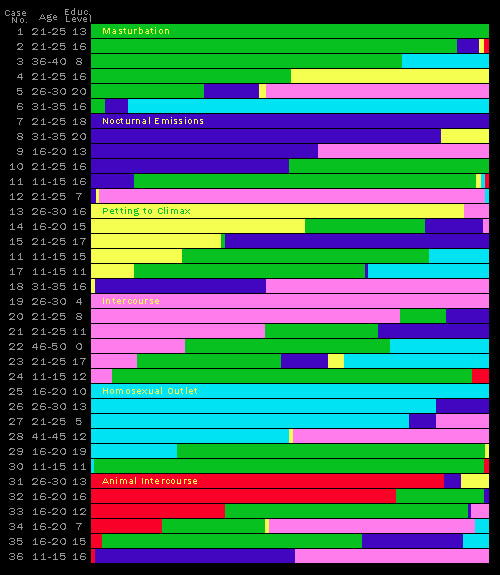
There are, both theoretically and in actuality, endless possibilities in combining these several sources of outlet and in the extent to which each of them contributes to the total picture (Figure 31).

Figure 31. Diverse examples of combinations of six sources of outlet.
Each bar shows a combination of outlets used by one individual
“Educ. level 0-8 years” grade school
“Educ. level 9-12 years” high school
“Educ. level 13-16 years” college
“Educ. level 17-20 years” postgraduate

The record of a single sort of sexual activity, even though it be the one most frequently employed by a particular group of males, does not adequately portray the whole sexual life of that group. Published figures on the frequency of marital intercourse, for instance (Pearl 1925), cannot be taken to be the equivalent of data on the frequency of total outlet for the married male; for marital intercourse may provide as little as 62 per cent of the orgasms of certain groups of married males (Table 97).

Similarly, studies of masturbation among college and younger students are not the equivalents of studies of total sexual outlet for such a group. Again, many persons who are rated “homosexual” by their fellows in a school community, a prison population, or society at large, may be deriving only a small portion of their total outlet from that source. The fact that such a person may have had hundreds of heterosexual contacts will, in most cases, be completely ignored. Even psychologic studies have sometimes included, as “homosexual,” persons who were not known to have had more than a single overt experience. In assaying the significance of any particular activity in an individual history, or any particular type of sexual behavior in a population as a whole, it is necessary to consider the extent to which that activity contributes to the total picture. Since all previously published rates on human sexual activity have been figures for particular outlets, such as masturbation or marital intercourse, the figures given in the present study on total outlet are higher than previous data would have led one to expect.

The average (mean) frequency of total sexual outlet for our sample of 3905 white males ranging between adolescence and 30 years of age is nearly 3.0 per week. It is precisely 2.88 for the total population of that age, or 2.94 for the sexually active males in that population (Table 40, Figure 32). For the total population, including all persons between adolescence and 85 years of age, the mean is 2.74.

These average figures, however, are not entirely adequate, for they are based upon the particular groups of males who have contributed so far to this study. Subsequent analyses will show that there are differences in mean frequencies of sexual activity, dependent upon such factors as age, marital status, educational, religious, and rural-urban backgrounds, and on still other biologic and social factors. In order to be intelligible, any discussion of sexual outlet should be confined to a particular group of persons whose biologic condition, civil status, and social origins are homogeneous. Most of the present volume is concerned with the presentation of data for such homogeneous groups. If there is any advantage in having a generalized figure for the population of the country as a whole, that figure is best calculated by determining the frequencies for a variety of these homogeneous groups, determining the relative size of each of these groups in the national census, and then, through a process of weighting of means, reconstructing the picture for a synthetic whole.

For this synthesized population, which more nearly represents the constitution of the nation as a whole, we arrive at a figure of 3.27 per week for the total sexual outlet of the average white American male under thirty years of age (Table 40). For all white males up to age 85, the corrected mean is 2.34 per week. The latter figure is lower because of the inactivity of the older males.

>>