<< Sexual Aging >>

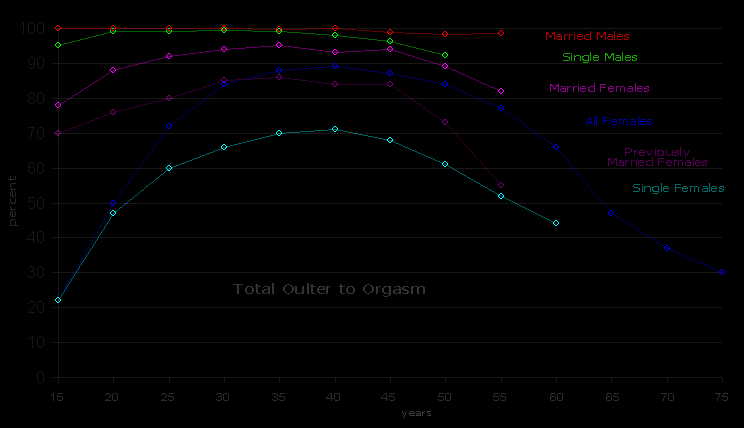
Sexual responses depend upon a basic anatomy which is essentially the same in the female and the male, and involve physiologic processes which, again, are essentially the same in the two sexes. However, some of the differences in the sexual behavior of females and males may be affected by psychosexual stimuli and some of the most striking differences between the aging patterns of the two human sexes — differences in the earlier development of sexual responsiveness in the male and its later development in the female — are not explainable by anything that we know about the anatomy or physiology of sexual response, or about the relative significance of psychologic stimuli in females and males. The male’s capacity to be stimulated sexually shows a marked increase with the approach of adolescence, and the incidences of responding males, and the frequencies of response to the point of orgasm, reach their peak within three or four years after the onset of adolescence (Figure 143f). On the other hand, the maximum incidences of sexually responding females are not approached until some time in the late twenties and in the thirties (Figures 99f, 150f), although some individuals become fully responsive at an earlier age.

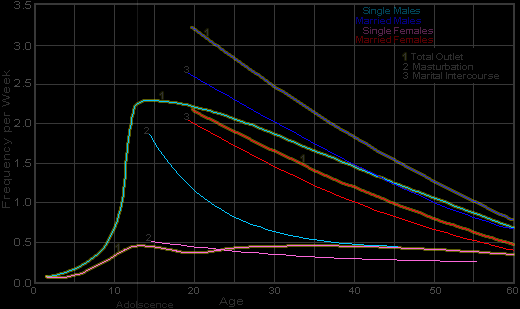
Having reached its peak in adolescence, sexual activity in the male begin to decline and drops steadily from then — the late teens or early twenties — into old age (Tables 44, 45, Figures 34, 35, 36, 143f). As far as human sexuality is concerned, aging begins at least with the onset of adolescence; and if the capacity (rather than the performance) of the pre-adolescent is taken into account (Chapter 5), it seems more correct to think of aging as a process that sets in soon after the initiation of growth. The sexagenarian — or octogenarian — who suddenly becomes interested in the problems of aging is nearly a lifetime beyond the point at which he became involved in that process. On the other hand, among females the median frequencies of those sexual activities which are not dependent upon the male’s initiation of socio-sexual contacts, remain more or less constant from the late teens into the fifties and sixties (Figures 143f-145f).

It will be interesting to know how many of the other physical and physiologic functions of the human animal reach their prime before the twenties. There are a few studies of physiologic aging, and the data (just as with sexual aging) show a steady degeneration of capacities from the age of the youngest child studied. This, for instance, has been shown for such phenomena as basal heart rate, resting oxygen intake and intake during maximum work, respiratory quotient, and carbon dioxide and lactic acid relations during work (data and references in Robinson 1938). In everyday affairs, it is to be noted that armies and navies, and others who depend on manpower to accomplish work, know that the male in his late teens has physical quality, nervous coordination, and capacity for recovery that are beyond those of the even slightly older man. But research on aging has concerned itself primarily with very old individuals, and too often failed to consider such fundamentals as might be seen only in the beginnings of the processes. Aging studies need to be re-oriented around the origins of biologic decline, and that will mean around pre-adolescence or early adolescence in regard to at least some aspects of human physiology.

Table 45, 153f, 154f. Total sexual outlet to orgasm
Total Outlet to orgasm in relation to Marital Status and Age
Age
Group
Cases Total Outlet: Sample Population Total Outlet:
U. S. Population
Total Population Active Population Total
Popul.
Active
Population
Mean
Frequency
Median
Freq.
Incid.
%
Mean
Freq.
Median
Freq.
Mean
Freq.
Incid.
%
Mean
Freq.
Single Males
Adol.-15 3012 2.91 ± 0.05 2.18 95.1 3.06 2.33 3.17 94.2 3.36
16-20 2868 2.88 ± 0.05 2.19 99.2 2.90 2.22 3.30 98.8 3.35
21-25 1535 2.67 ± 0.07 1.95 99.1 2.70 1.97 3.04 97.9 3.11
26-30 550 2.63 ± 0.11 1.90 99.3 2.65 1.92 2.94 98.6 2.98
31-35 195 2.38 ± 0.21 1.58 99.0 2.40 1.60 2.44 99.2 2.46
36-40 97 2.07 ± 0.21 1.36 97.9 2.12 1.39 2.00 98.5 2.04
41-45 56 1.79 ± 0.28 0.98 96.4 1.85 1.05 .... .... ....
46-50 39 1.88 ± 0.43 1.00 92.3 2.04 1.13 .... .... ....
Married Males
16-20 272 4.67 ± 0.29 3.21 100.0 4.67 3.21 4.83 100.0 4.83
21-25 751 3.90 ± 0.14 2.81 100.0 3.90 2.81 4.14 100.0 4.14
26-30 737 3.27 ± 0.12 2.47 100.0 3.27 2.47 3.51 100.0 3.51
31-35 569 2.73 ± 0.11 2.08 100.0 2.73 2.08 2.90 100.0 2.90
36-40 390 2.46 ± 0.13 1.89 99.7 2.47 1.89 2.42 99.9 2.42
41-45 272 1.95 ± 0.12 1.61 100.0 1.95 1.61 1.95 100.0 1.95
46-50 175 1.79 ± 0.16 1.18 98.9 1.81 1.20 1.80 98.1 1.83
51-55 109 1.54 ± 0.18 1.00 98.2 1.57 1.04 1.54 97.2 1.58
56-60 67 1.08 ± 0.12 0.79 98.5 1.09 0.81 .... .... ....
All Females

Adol.-15

5677

0.3 ± 0.02

0.0

22

1.4 ± 0.08

0.5


16-20

5649

0.5 ± 0.02

0.0

50

1.1 ± 0.04

0.4

21-25

3607

1.2 ± 0.04

0.4

72

1.7 ± 0.05

0.8

26-30

2554

1.8 ± 0.06

0.8

84

2.2 ± 0.07

1.1

31-35

1855

1.8 ± 0.07

0.9

88

2.1 ± 0.08

1.1

36-40

1301

1.8 ± 0.09

0.8

89

2.0 ± 0.10

1.0

41-45

810

1.6 ± 0.11

0.6

87

1.9 ± 0.12

0.8

46-50

469

1.2 ± 0.10

0.4

84

1.4 ± 0.12

0.6

51-55

240

0.9 ± 0.13

0.3

77

1.1 ± 0.16

0.5

56-60

121

0.5 ± 0.08

0.2

66

0.7 ± 0.11

0.4

61-65

53

0.2 ± 0.06

0.0

47

0.5 ± 0.11

0,3

66-70

27

0.1 ± 0.04

0.0

37


71-75

10

0.1 ± 0.04

0.0

30


76-80

3

0.0

0.0

0


81-85

2

0.0

0.0

0


86-90

1

0.0

0.0

0

   
Single Females

Adol.-15

5677

0.3 ± 0.02

0.0

22

1.4 ± 0.08

0.5


16-20

5613

0.4 ± 0.02

0.0

47

0.9 ± 0.04

0.3

21-25

2810

0.6 ± 0.03

0.1

60

1.1 ± 0.05

0.4

26-30

1064

0.9 ± 0.07

0.2

66

1.4 ± 0.10

0.5

31-35

539

1.0 ± 0.12

0.2

70

1.4 ± 0.16

0.4

36-40

315

1.2 ± 0.17

0.3

71

1.7 ± 0.23

0.5

41-45

179

1.1 ± 0.24

0.2

68

1.6 ± 0.34

0.4

46-50

109

0.9 ± 0.22

0.1

61

1.4 ± 0.35

0.5

51-55

58

0.6 ± 0.25

52

1.1 ± 0.48

0.3

56-60

27

0.4 ± 0.23

0.0

44

0.9 ± 0.48

0.4

Married Females

16-20

578

2.8 ± 0.18

1.3

78

3.6 ± 0.22

1.3


21-25

1654

2.5 ± 0.09

1.5

88

2.8 ± 0.10

1.5

26-30

1661

2.4 ± 0.09

1.5

92

2.6 ± 0.09

1.5

31-35

1245

2.3 ± 0.09

1.3

94

2.4 ± 0.10

1.3

36-40

850

2.1 ± 0.11

1.1

95

2.2 ± 0.11

1.1

41-45

497

1.9 ± 0.14

0.9

93

2.0 ± 0.15

0.9

46-50

260

1.4 ± 0.15

0.7

94

1.5 ± 0.16

0.7

51-55

118

1.1 ± 0.17

0.6

89

1.2 ± 0.19

0.6

56-60

49

0.6 ± 0.11

0.4

82

0.8 ± 0.13

0.4

Previously Married Females

16-20

71

2.1 ± 0.62

0.2

70

2.9 ± 0.85

0.8


21-25

238

1.7 ± 0.23

0.4

76

2.3 ± 0.29

0.9

26-30

328

1.6 ± 0.18

0.4

80

2.0 ± 0.21

0.7

31-35

303

1.6 ± 0.18

0.4

85

1.9 ± 0.20

0.6

36-40

245

1.7 ± 0.20

0.5

86

1.9 ± 0.23

0.7

41-45

195

1.5 ± 0.21

0.4

84

1.8 ± 0.24

0.5

46-50

126

1.0 ± 0.14

0.3

84

1.2 ± 0.16

0.4

51-55

82

0.8 ± 0.21

0.2

73

1.1 ± 0.27

0.4

56-60

53

0.3 ± 0.09

55

0.6 ± 0.15

0.3

In this, and in the succeeding charts in this and the following chapter, means and medians represent average frequencies per week.
     “% of Total Outlet” in the total population shows what portion of the total number of orgasms is derived from masturbation in the total population.
A total of such figures for all the possible sources of outlet equals 100%, which is the total outlet of the group.
     “% of Total Outlet” for the active population represents the mean of the figures showing the percentage of the total outlet
which is derived from this source by each individual who has any masturbation in his history, in that particular age period.
The percents for the several possible outlets do not total 100% because different individuals are involved in the populations utilizing each type of outlet.

U. S. population figures are corrections of the raw data for a population whose age, marital status, and educational level
are the same as those shown in the U. S. Census for 1940.

Figure 13100. Total sexual outlet to orgasm in relation to marital status and age

Figures 143f-147f. Comparison of aging patterns among single and married females and males

For singles, showing contrasts in active median frequencies of orgasm in female activities which are not primarily dependent on the male.
For married, showing how active median frequencies of orgasm attained in socio-sexual contacts in the female are affected by the patterns of male activity.


From the early and middle teens, the decline in sexual activity is remarkably steady, and there is no point at which old age suddenly enters the picture. The calculations become more significant when the single and married males are analyzed separately (Table 45). There are no calculations in all of the material on human sexuality which give straighter slopes than the data showing the decline with age in the total outlet of the single males, or the similar curve showing the decline in outlet for the married males. Starting from a high point of 3.2 for the single males, or 4.8 for the married males, in the middle teens, the mean for both groups drops steadily to about the same point, 1.8 per week at 50 years of age, to 1.3 per week at 60 years, and to 0.9 per week at 70 years of age.

Individual males may show variations from this picture, but departures from a steady decline are exceptions in the population as a whole. There are some clinical studies (Norbury 1934, Mead and Stith 1940, Heller and Myers 1944, Bauer 1944, Werner 1945, et al.) which seem to show that some males reach a period in middle life that may be recognized as a climacteric, accompanied by an abrupt reduction in the frequency of sexual activity; but our own data show no such phenomena for the population as a whole, nor for most of the individuals in the population.

The decline in sexual activity of the older male is partly, and perhaps primarily, the result of a general decline in physical and physiologic capacity. It is undoubtedly affected also by psychologic fatigue, a loss of interest in repetition of the same sort of experience, an exhaustion of the possibilities for exploring new techniques, new types of contacts, new situations. Evidence of this is to be found in numerous cases of older males whose frequencies had dropped materially until they met new partners, adopted new sexual techniques, or embraced totally new sources of outlet. Under new situations, their rates materially rise, to drop again, however, within a few months, or in a year or two, to the old level. How much of the over-all decline in the rate for the older male is physiologic, how much is based on psychologic situations, how much is based on the reduced availability of contacts, and how much is, among educated people, dependent upon preoccupation with other social or business functions in the professionally most active period of the male’s life, it is impossible to say at the present time.

In addition to the decrease in frequency of total outlet, there is a more or less corresponding decrease in frequency for each type of outlet.

Table 46. Age and Number of Sources of Outlet
Age
Group
Cases % of Population Utilizing Each Number of Sources
Number of Sources Mean No.
of Sources
0 1 2 3 4 5 6
Adol.-15 3,378 5.4 25.3 36.7 22.0 8.3 2.0 0.3 2.10 ± 0.02
16-20 3,206 0.8 8.6 27.5 34.1 22.3 6.1 0.6 2.89 ± 0.02
21-25 2,106 0.5 10.5 28.6 35.3 22.8 2.2 0.1 2.77 ± 0.02
26-30 1,062 0.6 15.6 35.3 33.8 13.0 1.6 0.1 2.48 ± 0.03
31-35 704 0.4 23.0 37.5 32.1 6.1 0.8 0.1 2.24 ± 0.04
36-40 511 1.2 30.4 36.5 27.4 3.3 1.2 0.0 2.05 ± 0.04
41-45 358 1.7 36.3 33.5 25.4 2.5 0.6 0.0 1.92 ± 0.05
46-50 235 3.0 38.8 38.7 17.4 1.7 0.4 0.0 1.77 ± 0.06
51-55 151 3.2 43.8 31.1 19.9 1.3 0.7 0.0 1.74 ± 0.07
56-60 98 7.2 50.2 26.6 12.3 3.7 0.0 0.0 1.56 ± 0.10
Adol.-60 11,809 2.2 18.4 32.4 29.5 14.3 2.9 0.3 2.45
U.S.Popul. 10,000 2.0 25.8 33.1 27.4 9.7 1.8 0.1 2.22
Age
Group
Cases Accumulated % with Each Number of Sources
Number of Sources Median No.
of Sources
  1 2 3 4 5 6
Adol.-15 3,378   94.6 69.3 32.6 10.6 2.3 0.3 2.53
16-20 3,206   99.2 90.6 63.1 29.0 6.7 0.6 3.38
21-25 2,106   99.5 89.0 60.4 25.1 2.3 0.1 3.30
26-30 1,062   99.4 83.8 48.5 14.7 1.7 0.1 2.96
31-35 704   99.6 76.6 39.1 7.0 0.9 0.1 2.71
36-40 511   98.8 68.8 31.9 4.5 1.2 0.0 2.51
41-45 358   98.3 62.0 28.5 3.1 0.6 0.0 2.36
46-50 235   97.0 58.2 19.5 2.1 0.4 0.0 2.22
51-55 151   96.8 53.0 21.9 2.0 0.7 0.0 2.11
56-60 98   92.8 42.6 16.0 3.7 0.0 0.0 1.87
Adol.-60 11,809   97.8 79.4 47.0 17.5 3.2 0.3 2.91
U. S. Popul. 10,000   98.0 72.2 39.1 11.7 1.9 0.1 2.67

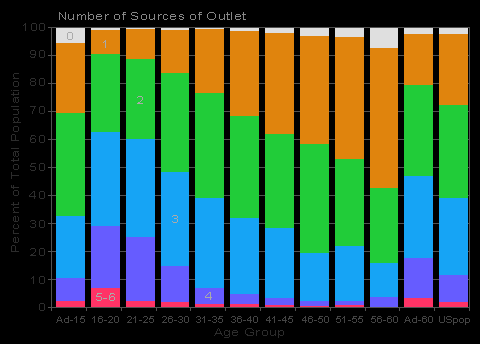
Effect of age on the number of different kinds of sexual outlet
(masturbation, dreams, intercourse, etc.) utilized in each age period.
Based on the whole population involved in the study.
Calculations of means for the U. S. population are based
on a theoretic population with the age distribution
found in the U. S. Census for 1940.

Figure 35. Number of sources of outlet in relation to age

The number of sources contributing to the total outlet is highest in the 16-20 year period. After that, some of the sources of outlet are abandoned in some of the histories. From the teens into old age there is a steady decline in number of sources utilized (Table 46, Figure 35). The mean number of sources of outlet for the older teen-age males is 2.9 (a median of 3.4), and there is a fair number of individuals (6.7%) of that age who have five or six kinds of outlet. By 60 years of age, the mean number of sources has dropped to 1.6 (the median is 1.9), and none of these 60-year olds has more than four sources of outlet.

Table 47. Age affecting physiologic capacities
Age
Group
Age Affecting Physical and Physiologic Characters
Medians
Erotic
Rating
Morning
Erections
,
frequencies
per week
Duration
of
Erection
,
minutes
Angle
of
Erection
(Higher Angles
Indicated by
Larger Figures)
Mucous
Secretion
(Greater
Abundance
Indicated by
Larger Figure)
Adol.-15 13.64 0.97 12.00 0.74 0.00
16-20 14.51 1.40 42.88 1.02 1.07
21-25 15.82 1.41 54.43 1.06 1.37
26-30 16.35 1.77 53.09 1.10 1.26
31-35 13.92 2.05 47.24 0.94 1.08
36-40 12.60 1.68 40.62 0.91 0.97
41-45 10.31 1.47 31.07 0.95 0.72
46-50 8.73 1.33 29.02 0.78 0.57
51-55 6.44 1.29 21.62 0.81 0.80
56-60 8.17  26.67  0.00
61-65 4.75 1.18 19.50 0.81 0.00
66-70 3.60 0.50 7.00 0.64 0.00
71+ 0.00  0.00  0.00
Data for angle of erection and for mucous secretion were coded,
and calculations based on the figures so obtained.

Throughout the life span, there is a steady decline in erotic responsiveness (Table 47). As measured by reactions to particular stimuli, each history in the present study has been rated on a scale which allows some comparison of persons of different degrees of responsiveness. Ratings for the entire white male population average, for instance, 16.4 at 26-30 years of age. The ratings then steadily drop, until they reach a median erotic rating of 3.6 between 66 and 70 years of age.

Frequencies of morning erection show some decline from younger to older age groups (Table 47). The frequency is probably highest in preadolescent or early adolescent boys, where we do not have sufficient data. The highest recorded median frequency is 2.05 per week between 31 and 35 years of age. By age 70 the median frequency is down to 0.50, and it drops still lower in older groups. There are a number of cases of persons who were able to record the amount of decrease in frequency of morning erections in their individual histories. There are some data that indicate that the frequency of morning erection is correlated with general physical vigor and, consequently, with frequency of sexual activity (e.g., Hamilton 1937), and that the steady decline in morning erections over the life span is therefore some measure of the decline in intensity of the sex drive in the male.

There is evidence of greater speed in reaching full erection during earlier years, and slower erection during later years, although this has been a difficult matter on which to secure calculable data. We have already drawn attention to the high sensitivity of pre-adolescent boys (Chapter 5). Older adults are definitely slower than youths in their teens and twenties. A number of our adults were able to estimate the changes which had occurred in the course of their lives. This gradual loss in speed of erection of the male becomes evident ten or twenty years before he becomes totally impotent.

The length of time over which erection can be maintained during continuous erotic arousal and before there is an ejaculation, drops from an average of nearly an hour in the late teens and early twenties to 7 minutes in the 66-70 year old group (Table 47). Under prolonged stimulation, as in heterosexual petting or group activities or in protracted homosexual activities, many a teen-age male will maintain a continuous erection for several hours, even when the physical contacts are at a minimum and, in some cases, even after two or three ejaculations have occurred. Very few middle-aged males, and no older ones, are capable of such a performance. A considerable loss in ability to maintain an erection becomes evident some years before the onset of complete impotence.

In any age group there is considerable variation in the angle at which the erect penis is carried on the standing male. The average position, calculated from all ages, is very slightly above the horizontal, but there are approximately 15 to 20 per cent of the cases where the angle is about 45° above the horizontal, and 8 to 10 per cent of the males who carry the erect penis nearly vertically, more or less tightly against the belly. The angle of erection is, in general, higher for males in the early twenties, and lower in more advanced ages (Table 47). Average angles become definitely reduced in males past fifty. It has been difficult to secure quite dependable estimates of angles from the subjects in this study, and it is probable that the changes in medians shown in the table do not express the full extent of the change with advancing age. There are records of 106 older males who recalled a change through the years of their own histories; and these cases indicate a more considerable drop in angle, even from near the vertical to the horizontal or, at later ages, to something below a horizontal position.

Table 178f. Accumulative Incidence: Onset of Menopause By Educational Level
AgeTotal
Sample
Educational Level Total
Sample
Educational Level
0-8 9-12 13-16 17+ 0-8 9-12 13-16 17+
  % PercentCases Cases
401 5 1 1 930177 170 252331
42 48 4 23 734 146137 191 260
447 15 93 5 578115 110 145208
46 1936 25 1011 461 9597 109 160
4831 45 3621 26 37182 86 78125
50 5172 48 3848 276 6071 55 90
52 73 9063  78 206 5057  58
54 88      164     
56 97      123     
58 99      102     
60 100      68     

With advancing age there is a steady reduction in the amount of pre-coital mucus which is, in a portion of the population, secreted from the urethra during sexual arousal and before ejaculation. In each age group there are about a third of the males who do not secrete such a mucus. Usually the secretion forms only a single clear drop; but for some males it amounts to several drops, or it is enough to wet the whole glans of the penis, or enough to drip. The greater abundance is found in the twenty-year old males, and there is a steady decline among the older males (Table 47). There are a few males who have been able to indicate the amount of reduction in their histories; but the record accumulated for the current ages (at time of reporting) gives a more definite picture of the decline The amount of mucus varies in any individual with the intensity of the erotic arousal, and it is probable that the lessened secretion of the older male is as much a measure of a reduction in the degree of arousal, as it may be of degenerating glands.

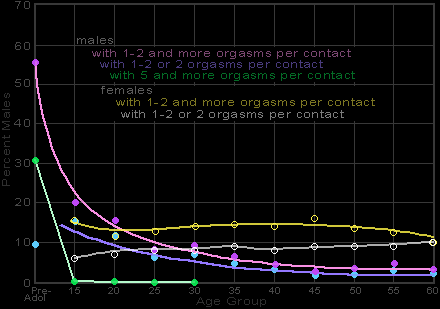
The capacity to reach repeated climax in a limited period of time definitely decreases with advancing age. Occasional multiple climax occurs in most of the histories, but regular multiple climax is characteristic of only a smaller number of males. The capacity is highest among those preadolescent boys (55.5%) who have sufficient sexual contact to test their capacities (Chapter 5), but multiple climax is still frequent among males (15% to 20%) in their teens and twenties (Table 48). While a few males (perhaps 3%) retain this capacity until they are 60 or older, most men lose it by 35 or 40 years of age.

Tables 48, 177f. Multiple orgasm and age in males and females
Average Number of Orgasms in Each Coital Experience
Age
Group
Total
Population
Active in
Coitus or
Homosexual
Capacities for Multiple Orgasm
Orgasms per Contact:
Number of Cases Involved
 
  1-2 2 2-3 3 4 5+ Total
Pre-adol. 182     17  18 10 56 101
Adol.-15 792   53 66 14 14 8 3 158
16-20 2092   91 155 32 28 10 2 318
21-25 2886   65 115 30 22 6 2 240
26-30 1225   43 44 15 7 2 1 112
31-35 866   21 20 10 2 3 0 56
36-40 630   13 6 7 2 1 0 29
41-45 431   3 3 2 1 1 0 10
46-50 278   2 3 2 1 1 0 9
51-55 172   2 3 1 1 1 0 8
56-60 101   1 1 0 1 0 0 3
Total 9655   294 433 113 97 43 64 1044
m a l e s f e m a l e s
Age Group Total
Population
Orgasms Per Contact:
% Of Active Population Involved
Age Group Cases
with any
Orgasm
Number of Orgasms:
% Of Active Population Involved
1 1-2 2 2-3 3 4 5+ Total 1 1-2 2 2-3 3 3-4 4 5+ Total
Pre-adol. 182 44.5   9.3  9.9 5.5 30.8 55.5 Pre-adol.                    
Adol.-15 792 80 6.7 8.3 1.8 1.8 1 0.4 20 Adol.-15 77 842 4 71 1 10 16
16-20 2092 84.8 4.3 7.4 1.5 1.3 0.5 0.1 15.2 16-20 84188 4 32 1 11 12
21-25 2886 91.7 2.3 4 1 0.8 0.2 0.1 8.3 21-25 1770 87 44 2 11 113
26-30 1225 90.9 3.5 3.6 1.2 0.6 0.2 0.1 9.1 26-30 173386 5 32 2 1 1 14
31-35 866 93.5 2.4 2.3 1.2 0.2 0.3 0 6.5 31-35 1366 85 54 2 11 1 115
36-40 630 95.4 2.1 1 1.1 0.3 0.2 0 4.6 36-40 96686 5 32 2 1 1 14
41-45 431 97.7 0.7 0.7 0.5 0.2 0.2 0 2 3 41-45 570 84 63 2 11 1 216
46-50 278 96.8 0.7 1.1 0.7 0.4 0.4 0 3.2 46-50 30386 5 41 1 11 1 14
51-55 172 95.3 1.2 1.7 0.6 0.6 0.6 0 4.7 51-55 127 87 63 0 10 2 113
56-60 101 97 1 1 0 1 0 0 3 56-60 4990 6 40 0 00 0 10

Capacity to have multiple orgasm in each sexual contact rapidly decreases with age.
The capacities of the pre-adolescent males and males in their teens being far beyond those of older adults.
Table includes 380 males who regularly have multiple climax in intercourse.
Table based on all females who had had coitus at least 25 times, irrespective of marital status.
The dash (–) indicates a percentage smaller than 0.5.

Figures 36, 151f. Capacity for multiple orgasm in relation to age

Active incidences in coitus.
For the male the curves show an aging effect,
and for the female a plateau extending from the mid-teens into the late fifties.
The differences between the two curves more or less parallel the differences
between the curves for the total outlet of single females and single males (Figure 143f).


Individuals differ in the way in which they age just as they differ in their frequencies and in their choices of sexual outlet. Generalizations which are based on averages of any sort must always be tempered with an understanding of the range of variation in each age group. Data on means and medians must not be confused with data on particular individuals, many of whom represent wide departures from any average.

It is important to note that the range of variation in physical and behavioral characters is greatest in the youngest groups and is gradually reduced in successive periods (Table 49). This means that older populations are more homogeneous than younger groups. This is true in regard to the frequency of total sexual outlet, and in connection with most but not all of the individual sources of outlet.

Table 49. Range of variation and age
Age
Group
Cases
Studies
Maximum Frequencies per Week
(Not Including the One Most Extreme Case in Each Group)
Total
Outlet
Mastur-
bation
Nocturnal
Emission
Pre-
Marital
Intercourse
Marital
Intercourse
Animal
Intercourse
Petting
to
Climax
Intercourse
with
Prostitutes
Homo-
sexual
Extra-
Marital
Intercourse
Adol.-15 3012 29.0 23.0 12.0 25.0   8.0 3.5 2.0 7.0 
16-20 2868 28.0 15.0 6.5 25.0 25.0 4.0 4.5 4.0 10.0 7.5
21-25 1535 29.0 12.0 6.5 25.0 29.0 1.0 7.0 7.0 11.0 18.0
26-30 550 29.0 9.0 4.0 16.0 25.0 0.1 4.0 4.0 15.0 6.0
31-35 195 29.0 7.0 3.0 13.0 20.0   1.0 3.0 4.5 4.0
36-40 97 22.0 7.0 2.0 8.5 20.0   0.5 2.5 4.0 4.0
41-45 56 15.0 7.0 1.0 6.5 14.0   0.5 1.5 5.0 2.0
46-50 39 14.0 6.0 1.0 3.5 14.0   0.1 2.5 5.0 2.5
51-55 173 7.0 1.5 1.0   6.0    1.0 0.1 2.0
56-60 106 4.5 0.5 0.5   3.0     0.1 2.0
61-65 58 4.0     5.0       2.0

Data based on histories of single (unmarried) males, except for marital and extra-marital intercourse.
The lower limits of the ranges are 0 or near 0,
and the maximum case is therefore a measure of the range of variation in each case.
Differences between the least active and most active individuals in each age group decrease with advancing age,
i.e., the range of variation becomes less, the homogeneity of the population increases, with advancing age.
Only the last 4 sources have the maximum cases in anything but the youngest groups.


Masturbation, nocturnal emissions, total pre-marital intercourse, and animal intercourse follow the general picture in having their maximum range of variation in the youngest years, and narrower ranges in the older years. On the other hand, pre-marital petting, pre-marital intercourse with prostitutes, homosexual activity, and extra-marital intercourse reach their maximum range of variation ten or more years beyond adolescence. The magnitudes of the ranges in these latter cases increase through the first age groups (in spite of reductions in sample size). The latter cases, it is to be noted, include more or less taboo activities. In these cases, the restriction of these ranges in the younger groups is probably due to the impact of the social tradition; and the achievement of maximum range and maximum mean frequency at a later period represents the gradual emancipation of the individual from the social tradition, and his final acceptance of a pattern which suits him. Many of the individual histories support such an interpretation. After reaching the maximum range, each of these outlets then follows the rule in having the range of variation drop in successive age periods.

>>