| Age |
Total Population |
Cases Impotent |
% Impotent |
Increment % |
| 10 | 4108 | 0 | 0 | |
| 15 | 3948 | 2 | 0.05 | 0.05 |
| 20 | 3017 | 3 | 0.1 | 0.05 |
| 25 | 1627 | 6 | 0.4 | 0.3 |
| 30 | 1025 | 8 | 0.8 | 0.4 |
| 35 | 741 | 10 | 1.3 | 0.5 |
| 40 | 513 | 10 | 1.9 | 0.6 |
| 45 | 347 | 9 | 2.6 | 0.7 |
| 50 | 236 | 16 | 6.7 | 4.1 |
| 55 | 134 | 9 | 6.7 | 0.0 |
| 60 | 87 | 16 | 18.4 | 11.7 |
| 65 | 44 | 11 | 25.0 | 6.6 |
| 70 | 26 | 7 | 27.0 | 2.0 |
| 75 | 11 | 5 | 55.0 | 28.0 |
| 80 | 4 | 3 | 75.0 | 20.0 |
|
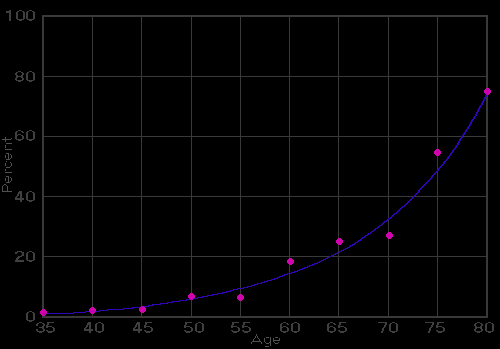
An accumulative incidence curve; based on cases which are more or less totally and, | ||||
|
|
||||
| Figure 37. Age of onset of impotence | ||||
|
Percent of total population which is impotent is shown for each age. |
||||
