| Age Group |
Cases | Total Outlet: Frequency Per Week | |||||||
| Total Sample Population | Active in Sample Population |
U. S. Population | |||||||
| Range (minus 1) |
Mean | Me- dian |
% of Total |
Mean | Me- dian |
Mean: Total Popul. |
Mean: Active Popul. | ||
| Adol.-15 | 3905 | 0.0-29+ | 2.86 ± 0.05 | 2.11 | 95.1 | 3.00 ± 0.05 | 2.26 | 3.17 | 3.36 |
| 16-20 | 3750 | 0.0-29+ | 2.87 ± 0.05 | 2.17 | 99.3 | 2.89 ± 0.05 | 2.19 | 3.32 | 3.37 |
| 21-25 | 2502 | 0.0-29+ | 2.85 ± 0.06 | 2.10 | 99.6 | 2.86 ± 0.06 | 2.11 | 3.35 | 3.40 |
| 26-30 | 1310 | 0.0-29+ | 3.01 ± 0.09 | 2.24 | 99.5 | 3.03 ± 0.09 | 2.25 | 3.35 | 3.38 |
| 31-35 | 879 | 0.0-29+ | 2.64 ± 0.10 | 1.91 | 99.7 | 2.65 ± 0.10 | 1.92 | 2.89 | 2.90 |
| 36-40 | 628 | 0.0-22.0 | 2.36 ± 0.10 | 1.73 | 99.5 | 2.37 ± 0.10 | 1.73 | 2.36 | 2.36 |
| 41-45 | 440 | 0.0-15.0 | 1.98 ± 0.11 | 1.41 | 99.1 | 2.00 ± 0.11 | 1.42 | 1.96* | 1.98* |
| 46-50 | 285 | 0.0-12.0 | 1.78 ± 0.12 | 1.10 | 97.5 | 1.82 ± 0.12 | 1.15 | 1.75* | 1.78* |
| 51-55 | 173 | 0.0-10.0 | 1.50 ± 0.14 | 0.90 | 96.0 | 1.57 ± 0.14 | 0.96 | ||
| 56-60 | 106 | 0.0-9.0 | 1.20 ± 0.15 | 0.73 | 95.3 | 1.26 ± 0.15 | 0.79 | ||
| 61-65 | 58 | 0.0-4.0 | 0.84 ± 0.16 | 0.52 | 81.0 | 1.04 ± 0.19 | 0.71 | ||
| 66-70 | 30 | 0.0-3.0 | 0.65 ± 0.24 | 0.30 | 73.3 | 0.88 ± 0.31 | 0.48 | ||
| 71-75 | 12 | 0.0-0.5 | 0.13 ± 0.07 | 0.00 | 41.7 | 0.30 ± 0.14 | 0.30 | ||
| 76-80 | 4 | 0.0-scant | 0.01 ± 0.01 | 0.00 | 25.0 | 0.05 | 0.10 | ||
| 81-85 | 2 | 0.0 | 0.00 | 0.00 | 0.0 | 0.00 | 0.00 | ||
| Total | 14084 | 0.0-29+ | 2.74 ± 0.02 | 1.99 | 97.9 | 2.80 ± 0.02 | 2.04 | ||
| Adol.-30 | 11467 | 0.0-29+ | 2.88 ± 0.03 | 2.14 | 98.0 | 2.94 ± 0.03 | 2.20 | ||
|
These data are based on the total population, | |||||||||
| * Starred items are corrected for marital status only. | |||||||||
|
|
|||||||||
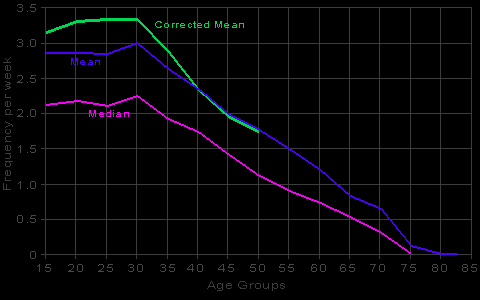
| Figure 34. Frequency of total outlet in relation to age | |||||||||
|
Based on total population, including single, married, and previously married groups. |
|||||||||
