Age | Hundred Percent
versus Partial Samples: Accumulative Incidence Data 1 |
Comparisons of Data Obtained by Three Interviewers Accumulative Incidence 2 |
Comparisons of Accumulative Incidence Data Obtained in Successive Periods 3 |
|||||||||||
| Masturbation: Educational Level 13+ | ||||||||||||||
| Partial Sample | 100% Sample | Histories
Taken by Kinsey |
Histories Taken by Pomeroy |
Histories Taken by Martin |
Histories
Taken 1938-1942 | Histories
Taken 1943-1946 | ||||||||
| Cases | % with Exper. | Cases | % with Exper. | Cases | % with Exper. | Cases | % with Exper. | Cases | % with Exper. | Cases | % with Exper. | Cases | % with Exper. | |
| 8 | 2815 | 0.0 | 656 | 0.0 | 1783 | 0.0 | 595 | 0.2 | 324 | 0.0 | 1166 | 0.0 | 637 | 0.0 |
| 9 | 2815 | 0.3 | 656 | 0.3 | 1783 | 0.3 | 595 | 0.5 | 324 | 0.0 | 1166 | 0.2 | 637 | 0.6 |
| 10 | 2815 | 2.3 | 656 | 2.1 | 1783 | 2.3 | 595 | 2.7 | 324 | 1.9 | 1166 | 1.7 | 637 | 3.5 |
| 11 | 2815 | 8.9 | 656 | 8.2 | 1783 | 8.1 | 595 | 11.4 | 324 | 9.3 | 1166 | 6.9 | 637 | 9.1 |
| 12 | 2815 | 27.9 | 656 | 26.2 | 1783 | 26.4 | 595 | 31.1 | 324 | 29.0 | 1166 | 26.5 | 637 | 25.3 |
| 13 | 2815 | 52.9 | 656 | 52.3 | 1783 | 52.3 | 595 | 56.3 | 324 | 50.0 | 1166 | 54.0 | 637 | 49.1 |
| 14 | 2815 | 72.2 | 656 | 72.0 | 1783 | 72.4 | 595 | 72.8 | 324 | 69.1 | 1166 | 74.3 | 637 | 68.6 |
| 15 | 2815 | 80.2 | 656 | 81.3 | 1783 | 79.6 | 595 | 80.8 | 324 | 81.5 | 1166 | 81.6 | 637 | 75.7 |
| 16 | 2814 | 84.3 | 655 | 85.2 | 1782 | 83.6 | 595 | 83.4 | 324 | 88.3 | 1166 | 84.8 | 637 | 81.6 |
| 17 | 2812 | 87.0 | 655 | 88.2 | 1781 | 86.6 | 594 | 86.0 | 324 | 90.4 | 1165 | 87.6 | 637 | 84.9 |
| 18 | 2736 | 88.9 | 611 | 90.2 | 1756 | 88.7 | 573 | 88.7 | 306 | 90.8 | 1147 | 89.7 | 629 | 87.0 |
| 19 | 2572 | 90.0 | 539 | 91.8 | 1642 | 90.0 | 548 | 89.2 | 283 | 91.5 | 1047 | 91.2 | 612 | 88.1 |
| 20 | 2337 | 91.1 | 457 | 92.3 | 1472 | 90.6 | 522 | 90.8 | 255 | 93.3 | 878 | 91.1 | 594 | 89.9 |
| 21 | 2031 | 92.0 | 383 | 92.4 | 1273 | 91.4 | 472 | 91.7 | 216 | 94.0 | 705 | 92.1 | 558 | 91.0 |
| 22 | 1670 | 92.8 | 312 | 93.3 | 1038 | 92.2 | 413 | 92.7 | 167 | 94.6 | 502 | 92.6 | 503 | 91.8 |
| 23 | 1396 | 93.3 | 269 | 93.3 | 874 | 92.6 | 370 | 93.5 | 127 | 96.1 | 351 | 91.5 | 445 | 92.8 |
| 24 | 1151 | 93.1 | 242 | 93.8 | 740 | 92.7 | 314 | 93.3 | 86 | 94.2 | 256 | 91.8 | 385 | 92.5 |
| 25 | 1002 | 93.9 | 203 | 94.6 | 663 | 93.5 | 275 | 94.2 | 56 | 96.4 | 199 | 93.0 | 320 | 92.2 |
| 26 | 884 | 94.9 | 163 | 95.7 | 582 | 94.2 | 250 | 96.0 | 154 | 93.5 | 256 | 92.6 | ||
| 27 | 774 | 95.3 | 124 | 96.0 | 512 | 94.7 | 222 | 96.4 | 102 | 94.1 | 204 | 93.1 | ||
| 28 | 699 | 95.3 | 110 | 95.5 | 467 | 94.6 | 202 | 96.5 | 68 | 94.1 | 163 | 92.6 | ||
| 29 | 634 | 95.0 | 94 | 94.7 | 432 | 94.2 | 179 | 96.6 | 51 | 92.2 | 134 | 94.0 | ||
| 30 | 573 | 95.6 | 79 | 96.2 | 400 | 95.0 | 154 | 96.8 | 107 | 95.3 | ||||
| 31 | 529 | 95.3 | 73 | 95.9 | 378 | 94.7 | 135 | 96.3 | 82 | 93.9 | ||||
| 32 | 492 | 95.5 | 67 | 98.5 | 353 | 94.9 | 125 | 96.8 | 72 | 94.4 | ||||
| 33 | 448 | 95.3 | 58 | 98.3 | 322 | 94.7 | 114 | 96.5 | 61 | 93.4 | ||||
| 34 | 412 | 95.9 | 51 | 98.0 | 299 | 95.0 | 101 | 98.0 | ||||||
| 35 | 382 | 95.8 | 277 | 94.9 | 95 | 97.9 | ||||||||
| 36 | 356 | 95.8 | 261 | 95.0 | 86 | 97.7 | ||||||||
| 37 | 323 | 95.7 | 233 | 94.8 | 81 | 97.5 | ||||||||
| 38 | 307 | 95.8 | 222 | 95.0 | 78 | 97.4 | ||||||||
| 39 | 280 | 95.4 | 207 | 94.7 | 66 | 97.0 | ||||||||
| 40 | 257 | 96.1 | 191 | 95.3 | 60 | 98.3 | ||||||||
|
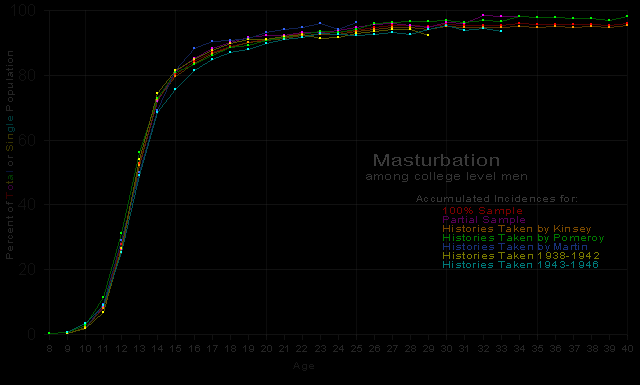
1 Data on Hundred Percent versus Partial Samples based on males of the college level. | ||||||||||||||
 | ||||||||||||||
|
Figures 8, 16, 22. Comparisons of accumulative incidence curves based on hundred percent and partial samples, obtained by different interviewers and by one interviewer in successive four-year periods | ||||||||||||||
|
Data on masturbation. | ||||||||||||||
