<< In Various Groups >>

Ultimately, between 92 and 97 per cent of all males have masturbatory experience (Tables 82, 132, Figures 98, 136). Males with the highest frequencies of masturbation are most often those who become adolescent first. These are the males who have the maximum total outlet throughout their lives (Chapter 9). During the early adolescent years these younger-maturing males masturbate about twice as frequently as the boys who became adolescent last, and between sixteen and twenty-five years of age they still masturbate with rates that are 50 to 60 per cent higher than those of the late-adolescent males (Table 73). The highest incidence (99%) of masturbation in any segment of the population is among these younger-adolescent boys. It is only 93 per cent of the late-adolescent boys who ever masturbate.

Masturbation, although it is found in practically all male histories, is very much restricted by the conventions of particular social groups. In all groups, however, masturbation is much more frequent in single histories. It provides about three-quarters (71%) of the sexual outlet for about 85 per cent of the single males below 15 years of age (Table 61, Figures 53-58). The accumulative incidence figures are hardly different for the high school and college groups, but the lower figure (92%) belongs to the grade school group. The highest active incidence between the ages of adolescence and 15 is to be found among the boys who never go beyond high school. In later age periods the college males have the highest incidence. The figure is lower for lower educational levels (52.3% for boys who never go beyond eighth grade) and higher (79.6%) for boys who will ultimately go to college.

The average frequencies of masturbation differ between social levels, more than the incidences. Average frequencies (active population) for the boys of the grade school level, between adolescence and fifteen years of age, are 1.8 per week; for the corresponding high school level, 2.2 per week; for the boys who will ultimately go to college, 2.7 per week (Table 82). The differences in frequencies become greater in the later age groups, and between adolescence and marriage the males of the college level masturbate more than twice as frequently as the males of the grade school level.

The number of females who had ever masturbated to the point of orgasm differed somewhat in the educational levels on which we have data. For instance, the accumulative incidences at age forty ranged from about 34 per cent among the females who had never gone beyond grade school, and 59 per cent for the females of the high school level, to 63 per cent among the females who had gone beyond college into graduate work (Table 27f). The females of the grade school and high school levels had not begun masturbation as often at older ages, particularly after they were married.
Davis 1929:157-158 (found no significant difference between educational levels; the non-college group began earlier). Lazarsfeld 1931:235 (found no differences; clinical cases ).

There are some differences in the active incidences of masturbation among unmarried females of the several educational levels (Table 27f). For instance, in the late teens, the active incidences among single females were 27 per cent in the grade school group and 34 per cent in the graduate school group (Table 27f). Among married females between twenty-one and twenty-five years of age, the active incidences ranged from 11 per cent for the grade school group to 31 per cent for the graduate school group (Table 27f).

Frequency to Orgasm. In our sample, the average (active median) frequencies of masturbation had been remarkably constant (usually 0.3 or 0.4 per week) among the single and previously married females of all the educational levels, and equally constant (usually 0.2 per week) among the married females of all the educational levels. Although the pattern of the social group to which she belonged may have influenced the female’s decision to masturbate or not to masturbate, it had little if anything to do with establishing the frequencies of her masturbation after she had once begun.

Among the youngest adolescent girls in the sample, masturbation had accounted for half (52 per cent) of the total outlet of the grade school group, three-fourths (73 per cent) of the outlet of the high school group, and over 90 per cent of the outlet of the college and graduate school groups (Table 27f). Females of the lower educational levels had more often depended on pre-marital coitus and less often accepted masturbation as a source of pre-marital outlet. They had more often feared that masturbation would do them physical harm, and more often considered it morally wrong and biologically abnormal. The girls who ultimately go on to college belong to a social group which considers masturbation more acceptable than pre-marital coitus. They are less often in conflict over the physical outcome or moral aspects of their masturbation, although they can become much disturbed at any consideration of coitus as a pre-marital activity.

The disparity between upper and lower educational levels was greatest in the youngest age groups, and much less among the older groups. As they grew older, there was a gradual reduction in the extent to which the unmarried, lower level females had depended on masturbation, but the reduction was more marked among those who had gone on into college. Consequently the differences were narrowed between the upper and lower educational groups.

While there were greater differences in the percentages of the total outlet which various groups of females had derived from their masturbation, the variations did not seem to correlate with the occupational classes of the homes in which the girls were raised.

Among those females in the sample who had actually masturbated, the active median frequencies in the younger generations were not particularly different from the frequencies with which the older generations had masturbated. Among the single females the median frequencies had averaged 0.3 to 0.4 per week. Among the married females they had averaged 0.2 to 0.3 per week.

Over the course of the four decades covered by the sample, the relative importance of masturbation among the single females had, with few exceptions, declined. Since neither the active incidences nor the active median frequencies of total outlet had particularly changed in this period of years, the decrease in the importance of masturbation must have been due to the increase which occurred in the frequencies of orgasm derived from petting and from pre-marital coitus. Masturbation, petting, and pre-marital coitus are the only forms of activity whose relative importance had materially changed in those four decades.

Table 82, 27f. Masturbation, as related to educational level
Age
Group
Educ.
Level
Masturbation, by Educational Levels
Males Females Males Females Educ.
Level
Age
Group
Cases Total Population Active Population Accum.
Incid.
%
Total Population Cases Total Population Active Population Accum.
Incid.
%
Total Population
Mean
Frequency
Median
Freq.
% of
Total
Outlet
Incid.
%
Mean
Freq.
Median
Freq.
Cases
in Total
Sample
% of
Total
Outlet
Active
Incid.
%
Mean
Frequency
Median
Freq.
% of
Total
Outlet
Incid.
%
Mean
Freq.
Median
Freq.
Cases
in Total
Sample
% of
Total
Outlet
Active
Incid.
%
Cases
in Total
Sample
% of
Total
Outlet
Active
Incid.
%
Single Males Single Females Married Males Married Females Previously Married
Add.-15 0-8 712 1.55 ± 0.078 0.85 52.25 84.7 1.84 1.12 84 162 52 21                             0-8 Add.-15
  9-12 606 1.93 ± 0.089 1.22 59.08 89.9 2.15 1.44 90 983 73 23 9-12  
  13 + 2799 2.22 ± 0.048 1.61 79.62 82.4 2.70 2.06 82 3271 93 17 13 +  
  17+   1128 90 24 17+  
16-20 0-8 720 0.93 ± 0.048 0.45 29.15 84.4 1.10 0.61 90 143 48 27 158 0.11 ± 0.031 0.00 2.40 28.5 0.39 0.14 29          0-8 16-20
  9-12 607 1.30 ± 0.074 0.69 37.17 89.0 1.46 0.84 94 976 44 29 87 0.14 ± 0.048 0.00 2.75 39.1 0.35 0.08 39 210 8 16     9-12  
  13 + 2861 1.79 ± 0.038 1.18 66.37 88.6 2.02 1.50 91 3299 66 25 46 0.35 ± 0.140 0.05 8.53 63.0 0.55 0.19 63 257 8 28     13 +  
  17+   1149 67 34   66 10 27     17+  
21-25 0-8 361 0.63 ± 0.057 0.18 20.15 62.3 1.01 0.50 91 67 39 24 324 0.10 ± 0.020 0.00 2.43 28.7 0.34 0.09 29 72 9 11     0-8 21-25
  9-12 263 0.87 ± 0.076 0.37 29.67 76.4 1.13 0.63 95 537 35 31 164 0.15 ± 0.037 0.00 3.70 41.5 0.37 0.09 42 487 5 2489 17 36 9-12  
  13 + 1898 1.31 ± 0.039 0.68 53.31 87.0 1.50 0.86 94 1204 48 33 440 0.32 ± 0.030 0.06 8.79 65.9 0.49 0.22 68 727 7 2889 29 45 13 +  
  17+   1002 47 39   368 7 31     17+  
26-30 0-8 159 0.59 ± 0.087 0.07 20.68 60.4 0.97 0.48 92     292 0.09 ± 0.024 0.00 2.44 21.2 0.40 0.08 29 81 6 20     0-8 26-30
  9-12 117 0.78 ± 0.095 0.35 27.69 78.6 0.99 0.47 97 181 38 36 135 0.18 ± 0.046 0.00 5.05 37.0 0.48 0.10 42 489 5 27100 14 44 9-12  
  13 + 487 1.18 ± 0.081 0.48 45.88 83.2 1.42 0.73 96 313 39 40 53.2 0.27 ± 0.023 0.06 8.67 66.4 0.41 0.18 69 671 7 30122 31 49 13 +  
  17+  531 43 47   421 9 4184 18 49 17+  
31-35 0-8       186 0.05 ± 0.019 0.00 1.79 19.4 0.24 0.07 29 68 5 15     0-8 31-35
  9-12  65 58 46 82 0.13 ± 0.045 0.00 4.04 36.6 0.37 0.10 42 338 7 3386 22 57 9-12  
  13+  139 30 47 301 0.24 ± 0.030 0.05 9.28 64.1 0.38 0.13 69 480 7 34107 19 50 13+  
  17+  309 47 53   360 9 4088 19 42 17+  
36-40 0-8       143 0.04 ± 0.013 0.00 1.59 11.2 0.32 0.20 29 50 6 22     0-8 36-40
  9-12       58 0.08 ± 0.030 0.00 3.15 25.9 0.32 0.18 42 210 9 3162 27 65 9-12  
  13+  68 32 56 189 0.21 ± 0.036 0.03 8.26 59.3 0.35 0.09 69 323 11 3385 13 54 13+  
  17+  205 41 57   268 10 4678 28 60 17+  
41-45 0-8       100 0.03 ± 0.013 0.00 1.41 9.0 0.30 0.23 29          0-8 41-45
  9-12                       117 9 36     9-12  
  13 +       138 0.19 ± 0.043 0.02 9.71 55.1 0.34 0.09 69 181 7 2967 14 54 13 +  
  17+  122 44 56  163 17 48 67 32 60 17+  
46-50 9-12        71 13 32      9-12 46-50
  13-16        91 10 30      13-16 
  17+  80 50 51  76 13 43      17+  
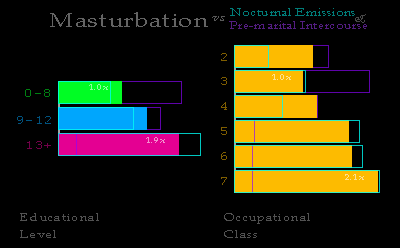
Figure 98. Masturbation, by educational level and occupational class

“Educ. level 0-8” are the males who never go beyond grade school.
“Educ. level 9-12” are the males who enter high school but never go beyond.
“Educ. level 13+” are the males who will ultimately go to college.

Occupational Class:
0. Dependents 1. Underworld
2. Day labor 3. Semi-skilled labor 4. Skilled labor
5. Lower white collar group 6. Upper white collar group 7. Professional group
8. Business executive group 9. Extremely wealthy group

For single males of the age group 16-20.
Relative lengths of bars compare mean frequencies for the groups.
Note similarity of data based on educational levels and data based on occupational classes.


At all ages, in all religious groups and in nearly all other subdivisions of the population, the highest incidences and frequencies of masturbation among single males, in all age periods, are in the college level, and the lowest incidences and frequencies among boys of lower educational levels, whether the calculations are made for total populations or for the active portions of the populations (that portion of the population which is actually utilizing this source of outlet). The accumulative incidence figures for the two groups are not very different, but the active incidence figures for any particular age period may differ more materially (Table 82).

Between 16 and 20, the incidence begins to go down for all levels, although up until marriage masturbation remains the chief source of sexual outlet for unmarried males who belong to that portion of the population that goes to college. Between 16 and 20, for instance, masturbation among the single males of college level occurs nearly twice as frequently as it does among the boys who never go beyond grade school, and the differential is still higher in the twenties. This is the great source of pre-marital sexual outlet for the upper educational levels. For that group, masturbation provides nearly 80 per cent of the orgasms during the earlier adolescent years, as against little more than half the outlet (52%) for the lower educational level. In the late teens it still accounts for two-thirds (66%) of the college male’s orgasms, while the lower level has relegated such activity to a low place that provides less than 30 per cent of the total outlet. In all later age periods the relative positions of these groups remain about the same.  At the college level, masturbation involves most of the males (96%) and continues to be the chief source (about 60%) of the outlet up until the time of marriage. The unmarried males who are actually in college draw nearly two-thirds of their total sexual outlet from masturbation, while pre-marital intercourse accounts for little more than a tenth of the outlet of the group (Table 64).

On the other hand, for boys who never get beyond the eighth grade in school, masturbation provides a little more than a quarter (29.2%) of the sexual outlet in their late teens. Masturbation in the more poorly educated groups may begin to drop out almost immediately after it is begun. There are lower level males who have masturbated only a single time or two, or a few times in their lives. Some of them may masturbate for a year or two, but then stop. By sixteen years of age 16 per cent of them has stopped masturbating, and nearly 40 per cent has stopped by the time age twenty has been passed. In these late teens masturbation supplies only about a fourth (29.2%) of the outlet for the lower level males.

Differences in incidences and frequencies of masturbation at different educational levels are even more striking among married males. As soon as marriage occurs, the incidence and frequency of masturbation drop considerably in all social levels. At the grade school level, there are only 20 to 30 per cent who masturbate in their early marital years, and the accumulative incidence figure climbs only a bit during the later years of marriage. In the grade school group of married males, only 1 to 3 per cent of the total sexual outlet is derived from masturbation. The frequencies in married histories are, however, definitely low, and there are few individuals who have rates that exceed once or twice per week. The high school group closely matches the grade school group in this regard.  At lower educational levels only about a third of the married males (29% to 42% in various groups) ever masturbate, and the frequencies are much lower than in upper levels, averaging not a quarter as high as in the corresponding group of single males. Most males of this level find it difficult to understand how a grown man could think of masturbating, particularly if he is married and living with his wife.

On the other hand, among the married males who have been to college, 60 to 70 per cent masturbate in each of the age periods. More than two-thirds (69%) of the college-bred males have some masturbation in their histories after marriage, and this provides no small part (about 9%) of the total outlet of the group after marriage. The proportion of the total sexual outlet derived by college males from this source begins at 8.5 per cent during the early years of marriage, and rises to as much as 18 per cent in the later years. The college group stands out as perfectly distinct on this score.

Table 108. Masturbation in relation to occupational class of parent and of subject
Age
Group
Occup.
Class
Reached
by
Subject
Cases Masturbation and Occupational Class
Total Population Active Population
Mean
Frequency
Me-
dian
Freq.
% of
Total
Outlet
Incid.
%
Mean
Frequency
Me-
dian
Freq.
Parental Occupational Class 2
Adol.-15 2 231 1.47 ± 0.11 0.91 56.07 89.6 1.65 ± 0.121.04
 3 126 1.40 ± 0.15 0.90 53.07 87.3 1.60 ± 0.161.18
16-20 2 198 1.15 ± 0.10 0.63 38.06 84.8 1.36 ± 0.110.83
 3 116 1.01 ± 0.12 0.48 28.95 89.7 1.13 ± 0.13 0.65
21-25 2 92 0.72 ± 0.10 0.33 29.86 72.8 0.99 ± 0.13 0.58
Parental Occupational Class 3
Adol.-15 2 140 1.61 ± 0.18 0.84 61.87 86.4 1.87 ± 0.20 1.04
 3 384 1.57 ± 0.10 0.95 51.99 88.8 1.77 ± 0.10 1.16
 5 205 2.07 ± 0.17 1.38 73.84 82.4 2.52 ± 0.18 1.80
 6+ 7 92 2.25 ± 0.26 1.61 81.23 83.7 2.69 ± 0.29 2.11
16-20 2 138 0.99 ± 0.12 0.43 35.15 83.3 1.19 ± 0.14 0.61
 3 318 1.00 ± 0.07 0.48 29.02 86.8 1.16 ± 0.08 0.64
 5 201 1.57 ± 0.14 0.85 55.57 87.6 1.79 ± 0.15 1.02
 6+ 7 94 2.13 ± 0.22 1.66 68.47 88.3 2.41 ± 0.24 2.00
21-25 2 64 0.47 ± 0.12 0.09 19.49 62.5 0.75 ± 0.18 0.35
 3 120 0.56 ± 0.08 0.17 16.91 65.0 0.86 ± 0.12 0.42
 5 124 1.09 ± 0.13 0.49 41.00 87.9 1.24 ± 0.14 0.68
 6+ 7 87 1.40 ± 0.16 0.73 53.00 90.8 1.54 ± 0.17 0.88
Parental Occupational Class 4
Adol.-15 3 107 1.94 ± 0.21 1.29 54.63 86.9 2.24 ± 0.22 1.54
 4 158 1.84 ± 0.15 1.31 72.58 88.6 2.07 ± 0.16 1.61
 5 304 2.18 ± 0.13 1.64 73.93 84.5 2.57 ± 0.14 2.08
 6 109 2.18 ± 0.21 1.71 77.39 82.6 2.64 ± 0.22 2.18
 7 74 2.56 ± 0.38 1.38 82.13 82.4 3.11 ± 0.40 2.25
16-20 3 105 0.98 ± 0.12 0.49 25.58 85.7 1.14 ± 0.13 0.66
 4 104 1.21 ± 0.14 0.70 44.31 89.4 1.35 ± 0.15 0.89
 5 305 1.64 ± 0.11 1.02 55.86 88.2 1.86 ± 0.12 1.43
 6 111 1.71 ± 0.17 0.98 57.31 85.6 2.00 ± 0.18 1.50
 7 75 2.21 ± 0.24 1.60 68.38 96.0 2.31 ± 0.24 1.75
21-25 5 183 1.17 ± 0.12 0.62 41.50 84.2 1.39 ± 0.14 0.86
 6 98 1.10 ± 0.13 0.65 43.15 84.7 1.30 ± 0.14 0.80
 7 71 1.37 ± 0.16 0.96 54.04 95.8 1.43 ± 0.17 1.03
Parental Occupational Class 5
AdoL-15 3 65 1.81 ± 0.24 1.18 54.18 92.3 1.96 ± 0.25 1.30
 5 563 2.13 ± 0.09 1.62 78.07 85.1 2.51 ± 0.10 1.94
 6 228 2.17 ± 0.151.69 76.69 83.3 2.60 ± 0.17 2.08
 7 152 2.05 ± 0.22 1.10 78.48 80.3 2.55 ± 0.25 1.67
16-20 3 64 0.88 ± 0.12 0.57 29.35 89.1 0.99 ± 0.13 0.68
 5 516 1.68 ± 0.08 1.10 64.37 88.8 1.90 ± 0.09 1.36
 6 230 1.82 ± 0.13 1.27 67.29 88.3 2.06 ± 0.14 1.57
 7 155 1.60 ± 0.16 0.85 64.24 86.5 1.86 ± 0.17 1.16
21-25 5 262 1.22 ± 0.10 0.64 52.95 84.4 1.45 ± 0.11 0.85
 6 178 1.43 ± 0.14 0.65 57.18 85.4 1.67 ± 0.16 0.91
 7 143 1.18 ± 0.12 0.57 49.68 85.3 1.38 ± 0.14 0.79
Parental Occupational Class 6
Adol.-15 5 98 2.74 ± 0.28 1.83 74.71 91.8 2.98 ± 0.29 1.98
 6 1048 2.29 ± 0.08 1.72 81.20 85.1 2.69 ± 0.09 2.13
 7 244 2.24 ± 0.19 1.34 76.23 79.1 2.84 ± 0.22 2.00
16-20 5 100 1.94 ± 0.20 1.55 52.46 90.0 2.16 ± 0.20 1.72
 6 1021 1.73 ± 0.06 1.18 66.93 90.0 1.92 ± 0.06 1.44
 7 246 2.17 ± 0.17 1.58 68.26 89.0 2.44 ± 0.19 1.81
21-25 5 71 1.27 ± 0.16 0.78 41.97 81.7 1.56 ± 0.18 1.25
 6 554 1.27 ± 0.07 0.68 54.80 87.5 1.45 ± 0.07 0.87
 7 236 1.38 ± 0.13 0.74 48.66 86.9 1.59 ± 0.14 0.91
26-30 6 103 0.94 ± 0.13 0.46 39.84 84.5 1.11 ± 0.14 0.64
 7 97 1.17 ± 0.25 0.44 39.22 79.4 1.48 ± 0.30 0.67
Parental Occupational Class 7
Adol.-15 7 414 2.39 ± 0.12 1.85 79.29 79.0 3.03 ± 0.13 2.42
16-20 7 416 2.12 ± 0.11 1.66 70.34 88.9 2.39 ± 0.12 1.87
21-25 7 266 1.51 ± 0.11 0.82 56.56 88.3 1.71 ± 0.11 0.99

All data based on single males.


Among occupational classes, the professional group masturbates most frequently (Table 108, Figure 98). This is true whether the persons in that class originate from parental class 7, or whether they come from parental classes 3, 4, or 6. Since essentially all professional persons have an educational rating of 17+ these data from an occupational class analysis are quite in line with the data based on educational levels. The distinctions between occupational classes are, however, even more extreme than the differences between educational levels, as far as masturbation is concerned.

Between the ages of 16 and 20, for instance, the males of occupational class 7 have average frequencies of masturbation which run 2.12,2.17, 2.21, and 1.60 per week, varying with the parental occupational class from which they came. The corresponding groups of occupational classes 2 and 3 have masturbatory frequencies which run very close to 1 per week—sometimes a bit more, sometimes a bit less in the various breakdowns. The educational breakdown for the same age period shows the college level masturbating with frequencies which are about 1.9 times the frequencies of the grade school males. Differences in the frequencies of the occupational classes are more nearly of the order of 2.2 to 2.5. Differences in attitudes on masturbation, pre-marital intercourse, and prostitution are among the most marked of all the distinctions between social levels, and this is true whether the calculations are made by educational levels or by occupational classes.

The professional males who originated in parental class 5, becoming members of class 7 as a result of their university training, have masturbatory rates which are 25 per cent lower than those of class 7 males who are derived from any other source. It is a striking situation for which we have no explanation at this time.

At lower levels there are definite taboos against masturbation. These may be fortified with the explanation that masturbation will drive one crazy, give one pimples, make one weak, or do some other sort of physical harm. More often masturbation is simply rejected because it is considered unnatural. The entire sexual philosophy at this level is turned around the acceptance of what is natural and the rejection of activities that are unnatural. The upper level’s wider acceptance of masturbation is rationalized on the ground that scientific investigation shows that it does no physical harm. Actually, however, the acceptance of masturbation in the upper level is probably the result of the very strong taboos which that group has against pre-marital intercourse. It is not a case of liking masturbation more, so much as it is a case of liking non-marital heterosexual relations less.

Tables 98, 103. Comparisons of older and younger generations of grade school level and of the college level:
masturbation, and nocturnal emissions
Accumulative Incidence, Two Generations
Age Masturbation Nocturnal Emissions
Educational Level 13+ Educational Level 0-8 Educational Level 13+ Educational Level 0-8
Older
Generation
Younger
Generation
Older
Generation
Younger
Generation
Older
Generation
Younger
Generation
Older
Generation
Younger
Generation
Cases % with
Exper.
Cases % with
Exper.
Cases % with
Exper.
Cases % with
Exper.
Cases % with
Exper.
Cases % with
Exper.
Cases % with
Exper.
Cases % with
Exper.
8 382 0.0 2433 0.0 322 0.0 476 0.0 381 0.0 2430 0.0 319 0.0 476 0.0
9 382 0.5 2433 0.3 322 0.0 476 0.2 381 0.0 2430 0.0 319 0.0 476 0.0
10 382 2.9 2433 2.2 322 0.0 476 1.5 381 0.0 2430 0.6 319 0.0 476 0.0
11 382 9.9 2433 8.8 322 1.2 475 4.1 381 3.9 2430 3.0 319 0.0 475 0.6
12 382 22.8 2433 28.6 322 8.7 475 20.4 381 12.9 2430 11.4 319 0.9 475 1.3
13 382 47.9 2433 53.7 322 23.0 475 44.0 381 32.5 2430 28.6 319 1.6 475 5.1
14 382 72.5 2433 72.2 322 49.7 472 70.1 381 57.7 2430 51.3 319 9.7 472 13.8
15 382 78.5 2433 80.5 322 67.4 466 86.7 381 73.5 2430 68.2 319 23.2 466 28.3
16 382 83.2 2432 84.4 322 77.3 447 91.9 381 85.3 2429 80.0 319 35.1 447 42.7
17 382 85.6 2430 87.2 322 80.7 405 93.1 381 89.5 2427 86.7 319 40.8 405 52.8
18 382 88.0 2354 89.1 322 84.2 373 94.9 381 91.6 2351 90.9 319 50.8 373 61.7
19 382 88.7 2190 90.3 322 85.1 333 94.6 381 92.7 2187 92.6 319 53.3 333 66.1
20 382 90.6 1955 91.2 322 85.4 299 95.0 381 94.2 1952 93.5 319 58.6 299 70.9
21 382 91.1 1649 92.2 322 85.4 274 95.3 381 95.3 1646 94.3 319 59.9 274 73.4
22 382 92.1 1288 93.0 322 85.4 243 95.5 381 95.8 1287 94.4 319 61.4 243 77.0
23 382 92.7 1014 93.6 322 85.4 222 95.9 381 96.1 1014 94.4 319 62.4 222 79.7
24 382 92.7 769 93.4 322 85.7 198 96.5 381 96.9 769 95.2 319 63.3 198 82.8
25 382 93.2 620 94.4 322 86.0 173 96.5 381 97.9 620 95.2 319 65.8 173 83.2
26 382 93.7 502 95.8 322 86.0 158 96.2 381 97.9 502 95.4 319 66.8 158 84.2
27 382 94.5 392 96.2 322 86.0 141 96.5 381 97.9 392 94.6 319 67.4 141 85.1
28 382 94.8 317 95.9 322 86.0 126 96.0 381 97.9 317 95.0 319 69.3 126 83.3
29 382 94.8 252 95.2 322 86.3 100 95.0 381 97.9 252 95.2 319 70.2 100 86.0
30 382 95.3 191 96.3 322 86.3 80 95.0 381 98.4 191 94.8 319 72.1 80 86.3
31 382 95.3 147 95.2 322 86.3 58 93.1 381 98.4 147 94.6 319 72.1 58 86.2
32 382 95.5 110 95.5 322 86.3     381 98.4 110 94.5 319 72.7    
33 382 95.5 66 93.9 322 86.3     381 98.4 66 92.4 319 73.0    
34         322 86.3             319 73.4    

Accumulative incidence data based on the life span.
 Median difference of age between the two generations is 22 years.

Figures 108-109, 119-120. Comparisons of accumulative incidence for older and younger generations
of college level and of grade school level: masturbation, nocturnal emissions

Showing percentage of males with experience at any time in the life-span.
Median age difference between the two generations is 22 years
.


The masturbatory records of older and younger generations of males from the college level are practically identical, both as to the percentage of persons involved and the frequencies of the activity (Table 98). The present-day masturbatory pattern of the college level male goes back at least twenty-two years; but there is a more conscious, more generally verbalized acceptance of the reality among college-bred males today. Moreover, the upper level attitude and its scientific acceptance of masturbation seems to have extended to at least some of the more poorly educated males in the population. For the younger generation of the grade school level, for instance, masturbation begins earlier, includes more persons, and is had nearly twice as frequently as it was had in the older generation.

At lower social levels, and particularly among the older generations of the lowest levels, masturbation may be looked down upon as abnormal, a perversion, and an infantile substitute for socio-sexual contacts. Although most lower level boys masturbate during their early adolescence, many of them never have more than a few experiences or, at the most, regular masturbation for a short period of months or years, after which they rarely again depend on such self-induced outlets. Among many of these lower level males, masturbation stops abruptly and immediately after the first experiences in heterosexual coitus. The lower level boy who continues to draw any material portion of his sexual outlet from masturbation after his middle teens may be much ashamed of it, and he may become the object of community jokes and of more serious disapproval if his history becomes known. In many instances, these attitudes are bolstered by rationalizations to the effect that masturbation does physical harm; but the objections are in reality based on the idea that masturbation is either abnormal, or else an admission that one is incapable of securing heterosexual intercourse and, therefore, socially inadequate. Among some primitive peoples (e.g., Bryk 1933), there is a somewhat similar attitude toward masturbation — an attitude which does not involve moral evaluations as much as it involves amusement at the social incapacity of the individual who has to resort to self stimulation for his sexual outlet. The better educated portion of the population which so largely depends upon masturbation for its pre-marital outlet, and which draws a not insignificant portion of its outlet from masturbation after marriage, will be surprised to learn what the less educated segments of the population think of one who masturbates instead of having intercourse.

The upper level more or less allows masturbation as not exactly desirable nor exactly commendable, but not as immoral as a socio-sexual contact. Older generations of the upper level were not so ready to accept masturbation. As many males were involved in the older generations, but the frequencies were definitely lower, and there was considerable moral conflict over the rightness or wrongness of the “habit”. Upper level males have accepted masturbation more freely within the last two or three decades, and today a high proportion of the teen-age boys of the college group frankly and openly admit this form of pre-marital outlet. During their years in college about 70 per cent of these males depend upon masturbation as their chief source of outlet. They derive about 66 per cent of their orgasms from this source during their college years.

The upper level’s pre-marital experience leads it to include masturbation as a source of outlet after marriage. The coital adjustments of this group in marriage are frequently poor, particularly because of the low degree of erotic responsiveness which exists among many of the college-bred females. This offers some excuse for masturbation among the married males of the group; but their early acceptance of masturbation in their pre-marital histories, and their tardy acceptance of heterosexual coitus, are prime determinants in the marital patterns. There are few things in all human sexual behavior which will surprise the poorly educated groups more than this considerable utilization of masturbation by the college-bred male as an outlet after marriage.

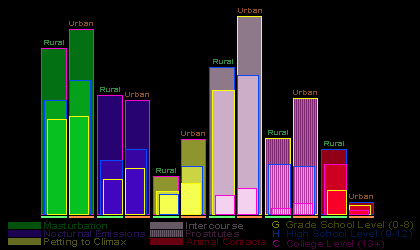
Self-induced orgasm occurs in almost exactly the same proportions of the rural and of the urban populations (Table 117). Boys in rural areas masturbate less often than boys raised in cities or towns, especially during adolescence. Frequencies are rather lower for the youngest adolescent group of farm boys who never go beyond eighth grade or high school; but at all ages the frequencies among the boys who will ultimately go to college are practically identical for the rural and for the urban groups. But since the farm boy has a somewhat lower total outlet than the city boy, and since the farm boy has definitely lower rates of socio-sexual contacts, and since the actual frequencies of masturbation are about the same as those of the urban group, masturbation provides a higher percentage of his total outlet than it does for the city boy. The part of the total outlet which the farm boy derives from masturbation is a bit higher at all ages and in all educational levels.

Tables 117, 33f, 32f. Masturbation to orgasm and rural-urban background
Age
Group
Rural-
Urban
Group
Cases Masturbation: Rural, Urban
Total Population Active Population Total Population
Mean
Frequency
Me-
dian
Freq.
% of
Total
Outlet
Active
Incid.
%
Mean
Frequency
Me-
dian
Freq.
Age
during
activity
Back-
grnd.
% of
total
outlet
Active
incid.
%
Cases
in
total
sample
Single Males: Educational Level 0-8 Single Females
Adol.-15 Rural 245 1.28 ± 0.11 0.75 55.0 80.8 1.59 ± 0.13 1.05 Adol.-15 Rural 86 21388
  Urban 401 1.76 ± 0.11 0.94 52.3 86.8 2.03 ± 0.13 1.19  Urban 86 205132
16-20 Rural 259 0.94 ± 0.07 0.48 33.6 84.9 1.11 ± 0.08 0.66 16-20 Rural 71 28386
  Urban 397 0.98 ± 0.07 0.45 28.7 84.6 1.16 ± 0.08 0.62  Urban 60 285080
21-25 Rural 141 0.67 ± 0.09 0.21 24.3 63.8 1.05 ± 0.13 0.57 21-25 Rural 53 30229
  Urban 188 0.64 ± 0.08 0.18 19.5 63.3 1.01 ± 0.12 0.48  Urban 46 352483
26-30 Rural 61 0.58 ± 0.12 0.05 19.6 54.1 1.07 ± 0.19 0.71 26-30 Rural 50 36104
  Urban 88 0.65 ± 0.13 0.11 22.0 64.8 1.01 ± 0.19 0.48  Urban 41 43915
Single Males: Educational Level 9-12 31-35Rural 65 3964
Adol.-15 Rural 124 1.66 ± 0.19 0.94 60.8 88.7 1.87 ± 0.20 1.19  Urban 39 50453
  Urban 459 2.07 ± 0.11 1.34 60.3 90.2 2.29 ± 0.11 1.56 All Females
16-20 Rural 124 1.13 ± 0.15 0.61 35.8 85.5 1.32 ± 0.17 0.82 Age Accumulative Incidence
  Urban 458 1.33 ± 0.07 0.74 37.2 90.2 1.47 ± 0.07 0.87 Rural Urban
21-25 Rural 50 0.68 ± 0.16 0.24 27.4 66.0 1.03 ± 0.23 0.61 % Cases % Cases
  Urban 209 0.92 ± 0.09 0.41 30.0 78.9 1.17 ± 0.10 0.66 5 1 397 2 5286
Single Males: Educational Level 13+ 10 6 397 8 5223
Adol.-15 Rural 352 2.28 ± 0.13 1.76 79.1 84.1 2.71 ± 0.14 2.17 15 21 394 20 5147
  Urban. 2587 2.24 ± 0.05 1.60 79.9 82.1 2.73 ± 0.06 2.08 20 29 332 34 3860
16-20 Rural 363 1.67 ± 0.08 1.18 67.3 89.0 1.88 ± 0.09 1.44 25 34 221 45 2458
  Urban 2640 1.86 ± 0.04 1.22 67.0 88.9 2.09 ± 0.05 1.54 30 38 167 51 1790
21-25 Rural 266 1.19 ± 0.08 0.79 56.4 86.1 1.38 ± 0.08 0.95 35 47 123 57 1280
  Urban 1753 1.35 ± 0.04 0.67 52.9 87.5 1.54 ± 0.05 0.85 40 49 83 59 822
26-30 Rural 85 1.09 ± 0.16 0.48 50.6 78.8 1.39 ± 0.19 0.94          
  Urban 445 1.15 ± 0.08 0.49 43.5 85.6 1.34 ± 0.09 0.68          
Figures 8, 16, 24. Comparisons of sexual activity in rural and urban groups among males

Comparing mean frequency data for the age period 16-20,
for three educational levels, for urban population and rural groups.


For females. there are sufficient samples for comparing masturbation in rural and urban populations in only five age groups.

In these samples, about 59 per cent of the city-bred females and 49 per cent of the rural females were ultimately involved in masturbation which had led to orgasm (the accumulative incidence, Table 32f). More of the city-bred females, and fewer of those raised on farms, had begun their masturbation after they had turned twenty (Table 32f). In consequence, the accumulative incidence curves level off sooner for the rural groups, and continue to rise in later years among the urban groups. On the other hand, more of the urban group seemed to masturbate in each five-year period (the active incidence) after the age of twenty (Table 33f).
Studies on masturbation with a rural-urban breakdown are rare. Gurewitsch and Grosser 1929:529 found a somewhat higher percentage of masturbation among rural females in their sample of 280 Ukrainian students. Pure conjectures are in: Caufeynon 1902:31 (more in urban). Sturgis 1907:397 (more in rural). Rohleder 1921:62 (more in urban).

The average (both median and mean) frequencies of masturbation among those females who were actively masturbating (the active sample) show no consistent differences between the rural and urban groups which are available for comparison.

Among the city-bred females, the total outlet had depended on masturbation to a slightly lesser degree (in four out of the five instances) than it had among the rural females (Table 33f). Since this is not due to any lower rate of masturbation, it obviously means that the total outlet of the city-bred females was higher, which is what the actual data show. This was because they were having more coitus before marriage.

In cities in many parts of the United States, there have been increasingly objective discussions of masturbation among social, professional, and religious groups. This seems to have happened less often in rural areas. Rural populations may reflect more of the taboos which were formerly current among older generations in both rural and urban groups.

In general, it will be seen that the sexual history of the individual accords with the pattern of the social group into which he ultimately moves, rather than with the pattern of the social group to which the parent belongs and in which the subject was placed when he lived in the parental home. Individuals originating from different parental classes have much the same histories, if they ultimately arrive at the same occupational rating. A half dozen persons who come from the same parental occupational class may have a half dozen different sorts of histories if they finally locate in that many different classes. These statements are, of course, based on averages for whole groups, and it may be anticipated that particular individuals in each and every one of these groups will depart from any average.

>>