<< Heterosexual-Homosexual balance >>

The histories which have been available in the present study make it apparent that the heterosexuality or homosexuality of many individuals is not an all-or-none proposition. It is true that there are persons in the population whose histories are exclusively heterosexual, both in regard to their overt experience and in regard to their psychic reactions. And there are individuals in the population whose histories are exclusively homosexual, both in experience and in psychic reactions. But the record also shows that there is a considerable portion of the population whose members have combined, within their individual histories, both homosexual and heterosexual experience and/or psychic responses. There are some whose heterosexual experiences predominate, there are some whose homosexual experiences predominate, there are some who have had quite equal amounts of both types of experience.

Some of the males who are involved in one type of relation at one period in their lives, may have only the other type of relation at some later period. There may be considerable fluctuation of patterns from time to time. Some males may be involved in both heterosexual and homosexual activities within the same period of time. For instance, there are some who engage in both heterosexual and homosexual activities in the same year, or in the same month or week, or even in the same day. There are not a few individuals who engage in group activities in which they may make simultaneous contact with partners of both sexes.

Males do not represent two discrete populations, heterosexual and homosexual. The world is not to be divided into sheep and goats. Not all things are black nor all things white. It is a fundamental of taxonomy that nature rarely deals with discrete categories. Only the human mind invents categories and tries to force facts into separated pigeon-holes. The living world is a continuum in each and every one of its aspects. The sooner we learn this concerning human sexual behavior the sooner we shall reach a sound understanding of the realities of sex.

There are some persons whose sexual reactions and socio-sexual activities are directed only toward individuals of their own sex. There are others whose psychosexual reactions and socio-sexual activities are directed, throughout their lives, only toward individuals of the opposite sex. These are the extreme patterns which are labeled homosexuality and heterosexuality. There remain, however, among both females and males, a considerable number of persons who include both homosexual and heterosexual responses and/or activities in their histories. Sometimes their homosexual and heterosexual responses and contacts occur at different periods in their lives; sometimes they occur coincidentally. This group of persons is identified in the literature as bisexual.

That there are individuals who react psychologically to both females and males, and who have overt sexual relations with both females and males in the course of their lives, or in any single period of their lives, is a fact of which many persons are unaware; and many of those who are academically aware of it still fail to comprehend the realities of the situation. It is a characteristic of the human mind that it tries to dichotomize in its classification of phenomena. Things either are so, or they are not so. Sexual behavior is either normal or abnormal, socially acceptable or unacceptable, heterosexual or homosexual; and many persons do not want to believe that there are gradations in these matters from one to the other extreme.
Attempts to categorize female homosexuality as congenital, real, genuine, acquired, situational, temporary, latent, partial, complete, total, absolute, regressive, progressive, pseudo-homosexuality, psychosexual hermaphroditism, bisexuality, inversion, perversity, etc., may be found, for instance, in: Féré 1904: 188. Parke 1906:320. Bloch 1908:489. Carpenter 1908:55. Freud 1910:2. Talmey 1910:143, 152. Moll 1912:125-130. Krafft-Ebing 1922:285-289, 336. Kelly 1930:136, 220. Robinson 1931:230-231. Marañón 1932:199. Potter 1933:151. Henry 1941(2):1023-1026. Hirschfeld 1944:281-282. Negri 1949: 163, 187. The concept of a continuum from exclusive heterosexuality to exclusive homosexuality is less often encountered, but is suggested, for instance, in: Freud 1924(2):207-208. Marañón 1929:170. Blanchard and Manasses 1930:109.

In regard to sexual behavior it has been possible to maintain this dichotomy only by placing all persons who are exclusively heterosexual in a heterosexual category, and all persons who have any amount of experience with their own sex, even including those with the slightest experience, in a homosexual category. The group that is identified in the public mind as heterosexual is the group which, as far as public knowledge goes, has never had any homosexual experience. But the group that is commonly identified as homosexual includes not only those who are known or believed to be exclusively homosexual, but also those who are known to have had any homosexual experience at all. Legal penalties, public disapproval, and ostracism are likely to be leveled against a person who has had limited homosexual experience as quickly as they are leveled against those who have had exclusive experience. It would be as reasonable to rate all individuals heterosexual if they have any heterosexual experience, and irrespective of the amount of homosexual experience which they may be having. The attempt to maintain a simple dichotomy on these matters exposes the traditional biases which are likely to enter whenever the heterosexual or homosexual classification of an individual is involved.

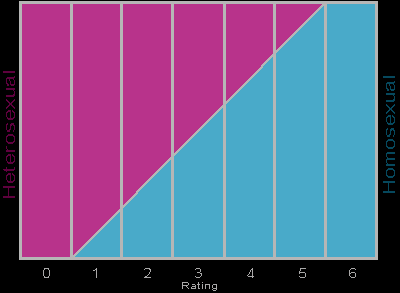
While emphasizing the continuity of the gradations between exclusively heterosexual and exclusively homosexual histories, it has seemed desirable to develop some sort of classification which could be based on the relative amounts of heterosexual and of homosexual experience or response in each history. Such a heterosexual-homosexual rating scale is shown in Figure 161.

Only a small proportion of the females and males in the available samples had had exclusively homosexual histories. An adequate understanding of the data must, therefore, depend upon some balancing of the heterosexual and homosexual elements in each history. This we have attempted to do by rating each individual on a heterosexual-homosexual scale which shows what proportion of her psychologic reactions and/or overt behavior was heterosexual, and what proportion of her psychologic reactions and/or overt behavior was homosexual. We have done this for each year for which there is any record.

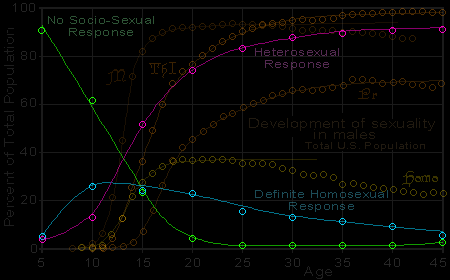
Figures 170, 95f. Development of heterosexuality and homosexuality
by age periods in males (♂) and females (♀)

Vs. masturbation (M), total heterosexual intercourse (ThI),
intercourse with prostitutes (ThI), and homosexual outlet (Homo)

Active incidence curves, corrected for U. S. population.
Males with no socio-sexual response (rating X) rapidly disappear between the ages of 5 and 20.
Males whose responses are chiefly heterosexual (rating 0 or 1)
rapidly increase in number until they ultimately account for 90 per cent of the whole population.
Males who are more than incidentally homosexual in response or overt activity (ratings 2-6)
are most abundant in pre-adolescence and through the teens,
gradually becoming less abundant with advancing age.

Figure 161. Heterosexual-homosexual rating scale

Based on both psychologic reactions and overt experience,
individuals rate as follows:

0. Exclusively/entirely heterosexual with no homosexual history

1. Largely heterosexual, but with incidental homosexual history
2. Largely heterosexual, but with a distinct homosexual history
3. Equally heterosexual and homosexual
4. Largely homosexual, but with distinct heterosexual history
5. Largely homosexual, but with incidental heterosexual history
6. Exclusively/entirely homosexual with no heterosexual history

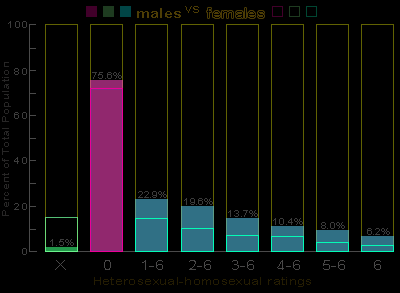
Figure 169. Heterosexual-homosexual ratings in total male population
(single and married) in any single year vs. single females

Based on U. S. Corrected data (last line of Table 150).
Showing percents of each population which have rated
“at least a 1,” “at least a 2,” “at least a 3,” etc.,
for at least 3 years between 16 and the age shown in column 1.
Passing experiences eliminated from data by showing only ratings
which have involved a period of at least three years after the males turned 16.
Percent shown as “X” have no socio-sexual contacts or reactions.

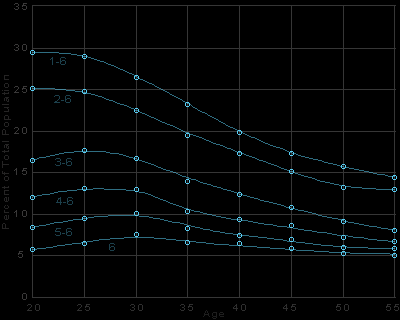
Figure 168. Accumulative incidence of heterosexual-homosexual ratings
in total male population (single and married), by age periods

X. No socio-sexual contacts or reactions
0. Exclusively heterosexual with no homosexual
1. Predominantly heterosexual, only incidentally homosexual
2. Predominantly heterosexual, but more than incidentally homosexual
3. Equally heterosexual and homosexual
4. Predominantly homosexual, but more than incidentally heterosexual
5. Predominantly homosexual, but incidentally heterosexual
6. Exclusively homosexual

Based on U. S. Corrected data.
Based only on ratings held by each individual for a period of at least three years.
All accumulative incidence curves should rise; these drop in older age periods because
(1) younger males today may be more often involved in homosexual activity, or
(2) older males forget their earlier experience, or
(3) older males deliberately cover up their homosexual experience.
Certainly the data for the earlier age periods are the most reliable.


• The ratings represent a balance between the homosexual and heterosexual aspects of an individual’s history, rather than the intensity of his or her psychosexual reactions or the absolute amount of his or her overt experience.
• Individuals who fall into any particular classification may have had various and diverse amounts of overt experience. An individual who has had little or no experience may receive the same classification as one who has had an abundance of experience, provided that the heterosexual and homosexual elements in each history bear the same relation to each other.
• The ratings depend on the psychologic reactions of the individual and on the amount of his or her overt experience. An individual may receive a rating on the scale even if he or she has had no overt heterosexual or homosexual experience.
• Since the psychologic and overt aspects of any history often parallel each other, they may be given equal weight in many cases in determining a rating. But in some cases one aspect may seem more significant than the other, and then some evaluation of the relative importance of the two must be made. We find, however, that most persons agree in their ratings of most histories after they have had some experience in the use of the scale. In our own research, where each year of each individual history has been rated independently by two of us, we find that our independent ratings differ in less than one per cent of the year-by-year classifications.
• An individual may receive a rating for any particular period of his or her life, whether it be the whole life span or some smaller portion of it. In the present study it has proved important to give ratings to each individual year, for some individuals may materially change their psychosexual orientation in successive years.
• While the scale provides seven categories, it should be recognized that the reality includes individuals of every intermediate type, lying in a continuum between the two extremes and between each and every category on the scale.


An individual may be assigned a position on this scale, for each age period in his life, in accordance with the following definitions of the various points on the scale:

0.    Individuals are rated as 0’s if all of their psychologic responses and all of their overt sexual activities are directed toward persons of the opposite sex. Such individuals do not recognize any homosexual responses and do not engage in specifically homosexual activities. While more extensive analyses might show that all persons may on occasion respond to homosexual stimuli, or are capable of such responses, the individuals who are rated 0 are those who are ordinarily considered to be completely heterosexual.

1.    Individuals are rated as 1’s if their psychosexual responses and/or overt experience are directed almost entirely toward individuals of the opposite sex, although they incidentally make psychosexual responses to their own sex, and/or have incidental sexual contacts with individuals of their own sex. The homosexual reactions and/or experiences are usually infrequent, or may mean little psychologically, or may be initiated quite accidentally. Such persons make few if any deliberate attempts to renew their homosexual contacts. Consequently the homosexual reactions and experience are far surpassed by the heterosexual reactions and/or experience in the history.

2.    Individuals are rated as 2’s if the preponderance of their psychosexual responses and/or overt experiences are heterosexual, although they respond rather definitely to homosexual stimuli and/or have more than incidental homosexual experience. Some of these individuals may have had only a small amount of homosexual experience, or they may have had a considerable amount of it, but the heterosexual element always predominates. Some of them may turn all of their overt experience in one direction while their psychosexual responses turn largely in the opposite direction; but they are always erotically aroused by anticipating homosexual experience and/or in their physical contacts with individuals of their own sex.

3.    Individuals who are rated as 3’s if they stand midway on the heterosexual-homo-sexual scale. They are about equally heterosexual and homosexual in their psychologic responses and/or in their overt experience. They accept or equally enjoy both types of contact and have no strong preferences for the one or the other.

4.    Individuals are rated as 4’s if their psychologic responses are more often directed toward other individuals of their own sex and/or if their sexual contacts are more often had with their own sex. While they prefer contacts with their own sex, they, nevertheless, definitely respond toward and/or maintain a fair amount of overt contact with individuals of the opposite sex.

5.    Individuals are rated 5’s if they are almost entirely homosexual in their psychologic responses and/or their overt activities. They respond only incidentally to individuals of the opposite sex, and/or have only incidental overt experience with the opposite sex.

6.    Individuals are rated as 6’s if they are exclusively homosexual in their psychologic responses, and in any overt experience in which they give any evidence of responding. Some individuals may be rated as 6’s because of their psychologic responses, even though they may never have overt homosexual contacts. None of these individuals, however, ever respond psychologically toward, or have overt sexual contacts in which they respond to individuals of the opposite sex.

X.    Finally, individuals are rated as X’s if they do not respond erotically to either heterosexual or homosexual stimuli, and do not have overt physical contacts with individuals of either sex in which there is evidence of any response. After early adolescence there are very few males in this classification, but a goodly number of females belong in this category in every age group. It is not impossible that further analyses of these individuals might show that they do sometimes respond to socio-sexual stimuli, but they are unresponsive and inexperienced as far as it is possible to determine by any ordinary means.


It will be observed that this is a seven-point scale, with 0 and 6 as the extreme points, and with 3 as the midpoint in the classification. On opposite sides of the midpoint the following relations hold:
0 is the opposite of 6
1 is the opposite of 5
2 is the opposite of 4

It will be observed that the rating which an individual receives has a dual basis. It takes into account his overt sexual experience and/or his psychosexual reactions. In the majority of instances the two aspects of the history parallel, but sometimes they are not in accord. In the latter case, the rating of an individual must be based upon an evaluation of the relative importance of the overt and the psychic in his history.

Table 147. Heterosexual-homosexual ratings for all white males
Age Cases Heterosexual-Homosexual Rating: Active Incidence
Total Population—U. S. Corrections
X 0 1 2 3 4 5 6
% % % % % % % %
5 4297 90.6 4.2 0.2 0.3 1.2 0.3 0.2 3.0
10 4296 61.1 10.8 1.7 3.6 5.6 1.3 0.5 15.4
15 4284 23.6 48.4 3.6 6.0 4.7 3.7 2.6 7.4
20 3467 3.3 69.3 4.4 7.4 4.4 2.9 3.4 4.9
25 1835 1.0 79.2 3.9 5.1 3.2 2.4 2.3 2.9
30 1192 0.5 83.1 4.0 3.4 2.1 3.0 1.3 2.6
35 844 0.4 86.7 2.4 3.4 1.9 1.7 0.9 2.6
40. 576 1.3 86.8 3.0 3.6 2.0 0.7 0.3 2.3
45 382 2.7 88.8 2.3 2.0 1.3 0.9 0.2 1.8
X. No socio-sexual contacts or reactions
0. Exclusively heterosexual with no homosexual
1. Predominantly heterosexual, only incidentally homosexual
2. Predominantly heterosexual, but more than incidentally homosexual
3. Equally heterosexual and homosexual
4. Predominantly homosexual, but more than incidentally heterosexual
5. Predominantly homosexual, but incidentally heterosexual
6. Exclusively homosexual

These are active incidence figures for the entire white male population,
including single, married, and post-marital histories,
the final figure corrected for the distribution of the population in the U. S. Census of 1940.
If the percentages are added from the right-hand side of each line,
the cumulated percents will show the portion of the population which rates 1 or more, or 2 or more, etc., in each age period.


In each classification there are persons who have had no experience or a minimum of overt sexual experience, but in the same classification there may also be persons who have had hundreds of sexual contacts. In every case, however, all of the individuals in each classification show the same balance between the heterosexual and homosexual elements in their histories. The position of an individual on this scale is always based upon the relation of the heterosexual to the homosexual in his history, rather than upon the actual amount of overt experience of psychic reaction.

Finally, it should be emphasized again that the reality is a continuum, with individuals in the population occupying not only the seven categories which are recognized here, but every gradation between each of the categories, as well. Nevertheless, it does no great injustice to the fact to group the population as indicated above.

From all of this, it should be evident that one is not warranted in recognizing merely two types of individuals, heterosexual and homosexual, and that the characterization of the homosexual as a third sex fails to describe any actuality.

It is imperative that one understand the relative amounts of the heterosexual and homosexual in an individual’s history if one is to make any significant analysis of him. Army and Navy officials and administrators in schools, prisons, and other institutions should be more concerned with the degree of heterosexuality or homosexuality in an individual than they are with the question of whether he has ever had an experience of either sort. It is obvious that the clinician must determine the balance that exists between the heterosexual and homosexual experience and reactions of his patient, before he can begin to help him. Even courts of law might well consider the totality of the individual’s history, before passing judgment on the particular instance that has brought him into the hands of the law.

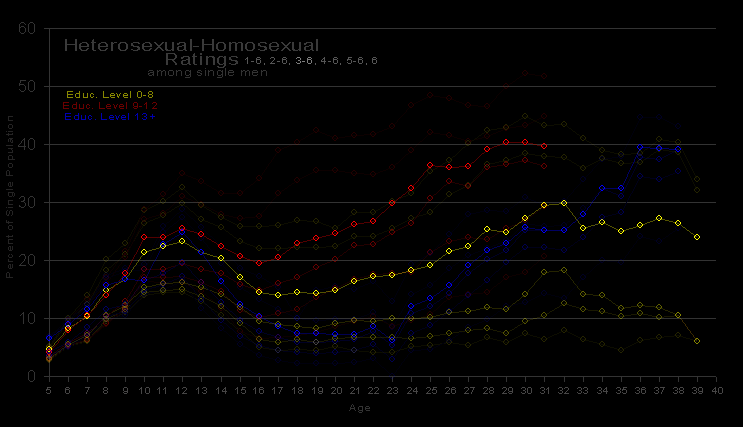
Figures 162-167. Active incidence curves: heterosexual-homosexual ratings, by age and educational level, among single males

“Educ. level 0-8” are the males who never go beyond grade school.
“Educ. level 9-12” are the males who enter high school but never go beyond.
“Educ. level 13+” are the males who will ultimately go to college.

The highlighted rate is 3-6 (at least as much homosexual reactions or experience as heterosexual)

Top figures show percent of single males who have at least incidental (or more) homosexual reactions or experience (ratings 1-6) in each year.
Next level shows percent of single males who have more than incidental homosexual reactions or experience (ratings 2-6).
Next level shows percent of single males who have as much as or more homosexual than heterosexual reactions or experience (ratings 3-6), in each year.
Next level shows percent of single males who have more homosexual than heterosexual reactions or experience (ratings 4-6) in each year.
Next level shows shows percent of single males who have more or less exclusively homosexual reactions or experience (ratings 5-6).
Bottom figures show percent of single males who are exclusively homosexual (rating 6) in each year.

Figure 163a. Active incidence curves: heterosexual-homosexual ratings, by age and educational level, among single males
“Educ. level 0-8” are the males who never go beyond grade school.
“Educ. level 9-12” are the males who enter high school but never go beyond.
“Educ. level 13+” are the males who will ultimately go to college.

X. No socio-sexual contacts or reactions
0. Exclusively heterosexual with no homosexual
2-6. At least more than incidentally homosexual

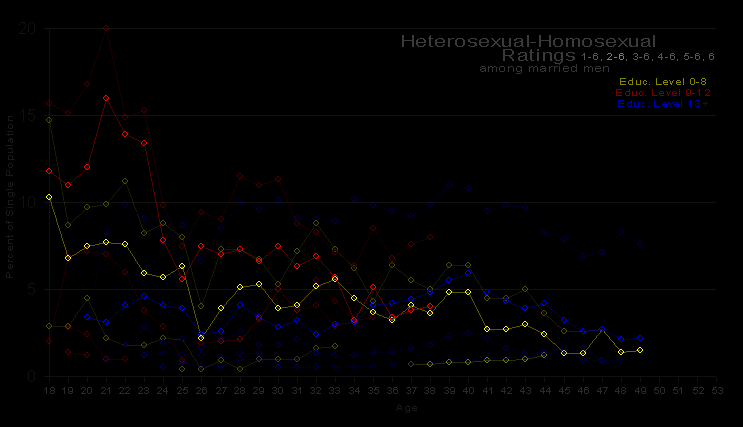
Figures 162m-167m. Active incidence curves: heterosexual-homosexual ratings, by age and educational level, among married males
“Educ. level 0-8” are the males who never go beyond grade school.
“Educ. level 9-12” are the males who enter high school but never go beyond.
“Educ. level 13+” are the males who will ultimately go to college.

The highlighted rate is 2-6 (at least more than incidentally homosexual)

Top figures show percent of married males who have at least incidental (or more) homosexual reactions or experience (ratings 1-6) in each year.
Next level shows percent of married males who have more than incidental homosexual reactions or experience (ratings 2-6).
Next level shows percent of married males who have as much as or more homosexual than heterosexual reactions or experience (ratings 3-6), in each year.
Next level shows percent of married males who have more homosexual than heterosexual reactions or experience (ratings 4-6) in each year.
Next level shows shows percent of married males who have more or less exclusively homosexual reactions or experience (ratings 5-6).
Bottom figures show percent of married males who are exclusively homosexual (rating 6) in each year.


Everywhere in our society there is a tendency to consider an individual “homosexual” if he is known to have had a single experience with another individual of his own sex. Under the law an individual may receive the same penalty for a single homosexual experience that he would for a continuous record of experiences. In penal and mental institutions a male is likely to be rated “homosexual” if he is discovered to have had a single contact with another male. In society at large, a male who has worked out a highly successful marital adjustment is likely to be rated “homosexual” if the community learns about a single contact that he has had with another male. All such misjudgments are the product of the tendency to categorize sexual activities under only two heads, and of a failure to recognize the endless gradations that actually exist.

From all of this, it becomes obvious that any question as to the number of persons in the world who are homosexual and the number who are heterosexual is unanswerable. It is only possible to determine how many persons belong, at any particular time, to each of the classifications on such a heterosexual-homosexual scale as is given above. Summarizing our data on the incidence of overt homosexual experience in the white male population (Tables 139-140, and Figures 156-158) and the distribution of various degrees of heterosexual-homosexual balance in that population (Tables 141-150, Figures 162-170), the following generalizations may be made:

37 per cent of the total male population has at least some overt homosexual experience to the point of orgasm between adolescence and old age (Figure 156). This accounts for nearly 2 males out of every 5 that one may meet.

50 per cent of the males who remain single until age 35 have had overt homosexual experience to the point of orgasm, since the onset of adolescence (Figure 156).

58 per cent of the males who belong to the group that goes into high school but not beyond, 50 per cent of the grade school level, and 47 per cent of the college level have had homosexual experience to the point of orgasm if they remain single to the age of 35 (Figure 158).

63 per cent of all males never have overt homosexual experience to the point of orgasm after the onset of adolescence (Figure 156).
50 per cent of all males (approximately) have neither overt nor psychic experience in the homosexual after the onset of adolescence (Figures 162-167).

• • 14-19 per cent of the unmarried females in the sample, and 1-3 per cent of the married females, had not made any socio-sexual responses (either heterosexual or homosexual)—i.e., rated X— in each of the years between twenty and thirty-five years of age. Among the previously married females, 5-8 per cent were in that category.

13 per cent of the males (approximately) react erotically to other males without having overt homosexual contacts after the onset of adolescence.

30 per cent of all males have at least incidental homosexual experience or reactions rate 1 to 6) over at least a three-year period between the ages of 16 and 55. This accounts for one male out of every three in the population who is past the early years of adolescence (Table 150, Figure 168)
• • • Something between 11-20 per cent of the unmarried females and 8-10 per cent of the married females in the sample were making at least incidental homosexual responses, or making incidental or more specific homosexual contacts—i.e., rated 1-6—in each of the years between twenty and thirty-five years of age. Among the previously married females, 14-17 per cent were in that category..

25 per cent of the male population has more than incidental homosexual experience or reactions (i.e., rates 2-6) for at least three years between the ages of 16 and 55. In terms of averages, one male out of approximately every four has had or will have such distinct and continued homosexual experience.

18 per cent of the males have at least as much of the homosexual as the heterosexual in their histories (i.e., rate 3-6) for at least three years between the ages of 16 and 55. This is more than one in six of the white male population.
• • • 4-11 per cent of the unmarried females in the sample, and 1-2 per cent of the married females, had made homosexual responses, and/or had homosexual experience, at least as frequently as they had made heterosexual responses and/or had heterosexual experience—i.e., rated 3-6—in each of the years between twenty and thirty-five years of age. Among the previously married females, 5-7 per cent were in that category.

13 per cent of the population has more of the homosexual than the heterosexual (i.e., rates 4-6) for at least three years between the ages of 16 and 55. This is one in eight of the white male population.
• • • 3-8 per cent of the unmarried females in the sample, and something under 1 per cent of the married females, had made homosexual responses and/or had homosexual experience more often than they had responded heterosexually and/or had heterosexual experience—i.e., rated 4-6—in each of the years between twenty and thirty-five years of age. Among the previously married females, 4-7 per cent were in that category.

10 per cent of the males are more or less exclusively homosexual (i.e., rate 5-6) for at least three years between the ages of 16 and 55. This is one male in ten in the white male population.
• • • 2-6 per cent of the unmarried females in the sample, but less than 1 per cent of the married females, had been more or less exclusively homosexual in their responses and/or overt experience —i.e., rated 5-6—in each of the years between twenty and thirty-five years of age. Among the previously married females, 1-6 per cent were in that category.
That fewer females than males are exclusively homosexual is also noted in: Havelock Ellis 1915(2):195. Potter 1933:151. Hesnard 1933:189. Cory 1951:88.

8 per cent of the males are exclusively homosexual (i.e., rate a 6) for at least three years between the ages of 16 and 55. This is one male in every 13.
4 per cent of the white males are exclusively homosexual throughout their lives, after the onset of adolescence (Table 150, Figure 168).
• • • 1-3 per cent of the unmarried females in the sample, but less than 3 in a thousand of the married females, had been exclusively homosexual in their psychologic responses and/or overt experience—i.e., rated 6—in each of the years between twenty and thirty-five years of age. Among the previously married females, 1-3 per cent were in that category.


None of those who have previously attempted to estimate the incidence of the homosexual have made any clear-cut definition of the degree of homosexuality which they were including in their statistics. As a matter of fact, it seems fairly certain that none of them had any clear-cut conception of what they intended, other than their assurance that they were including only those “who were really homosexual.” For that reason it is useless to compare the 2 or 3 per cent figure of Havelock Ellis, or the 2 to 5 per cent figure of Hirschfeld, or the 0.1 per cent figure of the Army induction centers with any of the data given above. The persons who are identified as “homosexuals” in much of the legal and social practice have rated anything between 1 and 6 on the above scale. On the other hand, there are some persons who would not rate an individual as “really homosexual” if he were anything less than a 5 or 6. Nevertheless, it should be emphasized again that there are persons who rate 2’s or 3’s who, in terms of the number of contacts they have made, may have had more homosexual experience than many persons who rate 6, and the clinician, the social worker, court officials, and society in general are not infrequently concerned with persons who rate no more than 2’s or 3’s. Many who rate only 1 or 2 are much disturbed over their homosexual experience, and they are frequently among those who go to clinicians for help.

Finally, it should be emphasized that the social significance of an individual’s history may or may not have any relation to his rating on the above scale. An older male who has never before had homosexual contact, may force a sexual relation with a small boy; and although he rates only a 1, he may so outrage the community that the full force of the law may be stirred up against him. On the contrary, most persons who rate 1’s have histories which do not disturb anybody. At the other end of the scale, some of the exclusively homosexual males may so confine their overt contacts that no social problems are raised, while others who also rate 6 are active wolves who are in continual trouble because of their open affronts to social conventions.

Extent of Female vs. Male Homosexuality
The incidences and frequencies of homosexual responses and contacts, and consequently the incidences of the homosexual ratings, were much lower among the females in our sample than they were among the males. Among the females, the accumulative incidences of homosexual responses had ultimately reached 28 per cent; they had reached 50 per cent in the males. The accumulative incidences of overt contacts to the point of orgasm among the females had reached 13 per cent; among the males they had reached 37 per cent. This means that homosexual responses had occurred in about half as many females as males, and contacts which had proceeded to orgasm had occurred in about a third as many females as males. Moreover, compared with the males, there were only about a half to a third as many of the females who were, in any age period, primarily or exclusively homosexual.

A much smaller proportion of the females had continued their homosexual activities for as many years as most of the males in the sample.

A much larger proportion (71 per cent) of the females who had had any homosexual contact had restricted their homosexual activities to a single partner or two; only 51 per cent of the males who had had homosexual experience had so restricted their contacts. Many of the males had been highly promiscuous, sometimes finding scores or hundreds of sexual partners.

There is a widespread opinion which is held both by clinicians and the public at large, that homosexual responses and completed contacts occur among more females than males. This opinion is not borne out by our data, and it is not supported by previous studies which have been based on specific data. This opinion may have originated in the fact that females are more openly affectionate than males in our culture. Women may hold hands in public, put arms about each other, publicly fondle and kiss each other, and openly express their admiration and affection for other females without being accused of homosexual interests, as men would be if they made such an open display of their interests in other men. Males, interpreting what they observe in terms of male psychology, are inclined to believe that the female behavior reflects emotional interests that must develop sooner or later into overt sexual relationships. Nevertheless, our data indicate that a high proportion of this show of affection on the part of the female does not reflect any psychosexual interest, and rarely leads to overt homosexual activity.
For instance, Clark 1937:70, and Bergler 1951:317, feel that the incidences of homosexuality among females exceed those among males. Others differentiate various types of homosexuality, and feel that incidental or temporary homosexuality is commoner in the female, as in: Bloch 1908:525, and Hirschfeld 1944:281. Others who estimate that homosexuality is equally common in both sexes include: Havelock Ellis 1915(2) :195. Krafft-Ebing 1922:397. Freud 1924(2):202. Kelly 1930:143. Sadler 1944:92.
All specific studies have arrived at incidence figures for the male which exceed those for the female: Hamilton 1929: 492-493 (57 per cent male, 37 per cent female). Bromley and Britten 1938:117, 210 (13 per cent male, 4 per cent female). Gilbert Youth Research 1951 (12 per cent male, 6 per cent female).


Not a few heterosexual males are erotically aroused in contemplating the possibilities of two females in a homosexual relation; and the opinion that females are involved in such relationships more frequently than males may represent wishful thinking on the part of such heterosexual males. Psychoanalysts may also see in it an attempt among males to justify or deny their own homosexual interests.

The considerable amount of discussion and bantering which goes on among males in regard to their own sexual activities, the interest which many males show in their own genitalia and in the genitalia of other males, the amount of exhibitionistic display which so many males put on in locker rooms, in shower rooms, at swimming pools, and at informal swimming holes, the male’s interest in photographs and drawings of genitalia and sexual action, in erotic fiction which describes male as well as female sexual prowess, and in toilet wall inscriptions portraying male genitalia and male genital functions, may reflect homosexual interests which are only infrequently found in female histories. The institutions which have developed around male homosexual interests include cafes, taverns, night clubs, public baths, gymnasia, swimming pools, physical culture and more specifically homosexual magazines, and organized homosexual discussion groups; they rarely have any counterpart among females. Many of these male institutions, such as the homosexually oriented baths and gymnasia, are of ancient historic origin, but there do not seem to have been such institutions for females at any time in history. The street and institutionalized homosexual prostitution which is everywhere available for males, in all parts of the world, is rarely available for females, anywhere in the world. All of these differences between female and male homosexuality depend on basic psychosexual differences between the two sexes.
In addition to our own data, female homosexual clubs and bars are recorded in : Bloch 1908:530. Caufeynon 1934:22. Hirschfeld 1944:285. McPartland 1947:149-150. Cory 1951:122 (more rare than male homosexual clubs and bars). Female homosexual prostitution is also noted, for example, in: Martineau 1886:31. Parke 1906:313. Rohleder 1907(2):493; 1925:338-339. Bloch 1908:530. Hirschfeld 1944:282.

Tables 141-146. Heterosexual-homosexual ratings for single and married white males

Heterosexual-Homosexual Rating: Active Incidence

Age Single White Males
Grade School Level (0-8) High School Level (9-12) College Level (13+)
Cases X 0 1 2 3 4 5 6 Age Cases X 0 1 2 3 4 5 6 Age Cases X 0 1 2 3 4 5 6
% % % % % % % % % % % % % % % % % % % % % % % %
5 820 92.6 2.3 0.1 0.4 1.5 0.2 0.1 2.8 5 631 90.8 4.4 0.3 0.3 0.8 0.3 0.2 2.9 5 2846 85.8 7.3 0.2 0.2 2.2 0.6 0.2 3.5
6 820 87.1 2.9 0.5 1.2 2.8 0.2 0.1 5.2 6 631 83.0 7.4 0.8 0.8 2.2 0.5 0.2 5.1 6 2846 82.5 7.7 0.3 0.6 3.0 0.7 0.2 5.0
7 819 81.8 4.2 1.5 2.2 3.2 0.9 0.2 6.0 7 631 77.7 9.0 1.1 1.7 3.0 1.1 0.2 6.2 7 2846 79.5 8.0 0.3 0.7 3.1 1.0 0.5 6.9
8 819 73.7 6.2 1.8 3.5 4.3 0.7 0.4 9.4 8 631 72.0 10.9 1.0 2.2 3.6 1.1 0.3 8.9 8 2846 73.1 9.5 0.5 1.2 4.1 1.2 0.6 9.8
9 819 70.5 6.6 1.8 4.3 4.6 0.7 0.5 11.0 9 631 68.7 9.7 1.1 2.7 4.8 1.1 0.3 11.6 9 2846 72.2 9.1 0.6 1.3 4.3 1.3 0.6 10.6
10 819 62.9 8.5 2.2 5.1 5.9 1.0 0.5 13.9 10 631 59.3 11.9 1.7 3.2 5.5 1.4 0.5 16.5 10 2846 63.9 11.3 0.9 1.9 5,5 1.7 0.7 14.1
11 818 59.9 10.0 2.3 5.4 6.4 1.1 0.5 14.4 11 631 56.0 12.7 3.2 4.1 5.5 1.4 1.1 16.0 11 2846 61.7 12.4 1.1 2.1 5.0 1.9 0.8 15.0
12 815 54.1 13.3 2.8 6.5 7.1 1.2 0.6 14.4 12 631 46.1 18.9 4.0 5.5 6.0 2.2 1.1 16.2 12 2846 51.5 19.7 1.4 2.5 5.2 2.4 1.0 16.3
13 814 49.8 20.8 2.3 5.7 6.0 1.6 0.9 12.9 13 631 40.3 26.1 4.0 5.2 6.0 2.2 1.6 14.6 13 2846 42.5 31.8 1.9 2.5 5.1 3.0 1.4 11.8
14 811 41.2 31.4 1.7 5.3 6.3 2.1 1.4 10.6 14 631 27.9 40.5 3.6 5.5 4.8 3.0 3.0 11.7 14 2846 30.0 47.6 3.0 3.0 3.7 3.0 1.5 8.2
15 803 32.0 42.1 2.7 6.2 5.1 2.7 1.5 7.7 15 629 19.9 48.6 4.3 6.5 4.8 4.6 3.5 7.8 15 2846 22.3 59.1 3.3 2.9 2.8 2.7 1.4 5.5
16 774 24.1 50.1 3.7 7.6 5.0 3.1 1.4 5.0 16 619 9.7 56.6 6.5 8.1 4.7 4.7 3.6 6.5 16 2843 13.8 68.9 4.0 3.0 2.5 2.5 1.7 3.6
17 708 17.5 56.4 4.0 8.1 5.1 3.1 1.4 4.4 17 577 4.9 56.2 7.3 11.1 4.5 5.2 4.0 6.8 17 2839 8.9 75.7 3.9 2.8 2.0 2.2 1.7 2.8
18 635 11.5 61.6 4.6 7.9 5.7 2.4 1.7 4.6 18 502 3.0 57.0 6.6 10.8 6.0 5.4 4.6 7.0 18 2755 5.7 79.5 4,8 2.5 1.6 1.8 1.8 2.3
19 550 10.7 62.5 4.5 8.0 6.0 2.5 1.3 4.5 19 420 2.4 55.2 6.9 11.7 5.0 5.2 6.0 7.6 19 2579 4.3 81.0 5.2 2.3 1.6 1.8 1.8 2.2
20 473 9.3 65.1 3.2 7.6 5.7 2.5 1.5 5.1 20 350 2.0 57.0 5.4 10.9 4.6 4.9 6.6 8.6 20 2306 3.9 80.6 5.6 2.6 1.3 1.8 1.9 2.3
21 386 8.8 63.0 4.1 7.8 6.7 2.9 2.3 4.4 21 274 1.5 56.9 6.6 8.8 3.6 5.8 7.3 9.5 21 1961 3.6 81.4 5.2 2.5 1.0 1.9 2.0 2.4
22 306 7.8 63.9 4.2 6.9 7.8 2.6 2.6 4.2 22 232 1.7 56.5 6.9 8.2 3.9 5.2 7.3 10.3 22 1527 3.2 80.4 5.4 2.3 1.0 2.2 2.4 3.1
23 269 8.2 61.7 4.5 8.2 7.4 3.3 2.6 4.1 23 197 1.5 55.4 7.1 6.1 5.1 7.1 9.1 8.6 23 1201 2.9 80.5 4.5 2.2 0.9 2.4 2.9 3,7
24 231 6.1 62.3 4.3 9.1 8.2 3.5 1.3 5.2 24 166 1.8 51.4 7.8 6.6 6.0 8.4 8.4 9.6 24 895 3.2 77.5 5.1 2.1 1.3 3.4 3.0 4.4
25 187 4.8 59.9 7.0 9.1 9.1 3.2 1.6 5.3 25 140 0.7 50.8 6.4 5.7 5.7 9.3 10.7 10.7 25 687 3.3 75.5 5.5 2.3 1.3 3.3 4.1 4.7
26 172 2.3 60.5 5.8 9.9 10.5 3.5 1.7 5.8 26 125 1.6 50.4 6.4 5.6 2.4 10.4 9.6 13.6 26 517 3.7 71.9 5.8 2.9 1.4 3.1 5.0 6.2
27 152 2.6 57.3 7.2 10.5 11.2 3.3 2.6 5.3 27 113 0.9 52.3 6.2 4.4 3.5 8.8 9.7 14.2 27 381 3.7 68.3 7.1 1.8 1.3 3.9 5.5 8.4
28 134 2.2 55.3 6.0 11.2 13.4 3.7 1.5 6.7 28 97 1.0 52.5 5.2 2.1 3.1 12.4 9.3 14.4 28 303 4.3 67.0 6.6 0.3 1.7 3.6 6.6 9.9
29 121 2.5 54.5 5.8 12.4 13.2 4.1 1.7 5.8 29 82 1.2 48.8 7.3 2.4 3.7 11.0 8.5 17.1 29 240 4.2 67.4 5.0 0.4 1.3 2.1 7.5 12.1
30 107 1.9 53.2 6.5 11.2 13.1 4.7 1.9 7.5 30 67 1.5 46.2 9.0 3.0 3.0 10.4 9.0 17.9 30 179 4.5 64.7 4.5 0.6 0.6 2.8 9.5 12.8
31 95 2.1 54.7 5.3 8.4 11.6 7.4 4.2 6.3 31 58 0.0 48.3 6.9 5.2 3.4 6.9 8.6 20.7 31 140 5.7 64.9 3.6 0.7 0.0 2.9 7.9 14.3
32 87 2.3 54.2 5.7 8.0 11.5 5.7 4.6 8.0                32 119 6.7 63.1 4.2 0.8 0.0 3.4 8.4 13.4
33 78 2.6 56.4 5.1 10.3 11.5 2.6 5.1 6.4                33 100 7.0 59.0 5.0 1.0 0.0 4.0 7.0 17.0
34 72 2.8 58.2 1.4 11.1 12.5 2.8 5.6 5.6                34 80 6.3 56.2 5.0 0.0 0.0 5.0 7.5 20.0
35 68 2.9 58.8 1.5 11.8 13.2 1.5 5.9 4.4                35 71 7.0 55.0 5.6 0.0 1.4 2.8 8.5 19.7
36 65 3.1 58.5 1.5 10.8 13.8 1.5 4.6 6.2                36 58 6.9 48.4 5.2 0.0 1.7 3.4 10.3 24.1
37 59 1.7 57.5 1.7 11.9 15.3 1.7 3.4 6.8                37 56 7.1 48.2 5.4 0.0 1.8 3.6 10.7 23.2
38 57 1.8 57.8 1.8 12.3 15.8 0.0 3.5 7.0                38 51 5.9 51.0 3.9 0.0 0.0 3.9 9.8 25.5
39 50 2.0 64.0 2.0 8.0 18.0 0.0 0.0 6.0                              
Age Married White Males
Grade School Level (0-8) High School Level (9-12) College Level (13+)
Cases X 0 1 2 3 4 5 6 Age Cases X 0 1 2 3 4 5 6 Age Cases X 0 1 2 3 4 5 6
% % % % % % % % % % % % % % % % % % % % % % % %
18 68 00.0 85.3 4.4 07.4 02.9 0.0 0.0 00.0 18 51 00.0 84.3 3.9 09.8 2.0 00.0 00.0 00.0               
19 103 0.0 91.3 1.9 3.9 2.9 0.0    19 73   84.9 4.1 4.1 4.1 1.4 1.4                
20 134 0.0 90.3 2.2 3.0 4.5 0.0    20 84   83.2 4.8 4.8 4.8 1.2 1.2  20 59 00.0 96.6 0.0 3.4 0.0 0.0 00.0 00.0
21 181 0.0 90.1 2.2 5.5 2.2 0.0    21 99   80.0 4.0 9.0 6.0 1.0 0.0  21 97 0.0 91.7 5.2 2.1 1.0 0.0 0.0 0.0
22 223 0.0 88.8 3.6 5.8 1.8 0.0    22 101   85.1 1.0 7.9 5.0 1.0 0.0  22 172 0.0 90.1 5.8 2.3 0.6 0.0 1.2 0.0
23 222 0.0 91.8 2.3 4.1 1.8 0.0    23 104   84.7 1.9 9.6 3.8 0.0 0.0  23 221 0.0 90.9 4.5 1.8 1.4 0.9 0.5 0.0
24 228 0.0 91.2 3.1 3.5 2.2 0.0    24 102   90.2 2.0 4.9 2.9 0.0 0.0  24 278 0.4 91.9 3.6 2.2 0.7 0.4 0.4 0.4
25 238 0.0 92.0 1.7 4.2 1.7 0.4    25 107   92.5 1.9 4.7 0.9 0.0 0.0  25 330 0.0 91.3 4.8 1.8 0.9 0.6 0.3 0.3
26 223 0.0 96.0 1.8 1.8 0.4 0.0    26 107   90.6 1.9 5.6 1.9 0.0 0.0  26 378 0.0 93.4 4.2 0.8 0.5 0.5 0.3 0.3
27 232 0.0 92.7 3.4 3.0 0.9 0.0    27 99   91.0 2.0 5.0 0.0 2.0 0.0  27 391 0.0 91.5 5.9 0.5 0.8 0.3 0.5 0.5
28 232 0.0 92.7 2.2 4.7 0.4 0.0    28 96   88.5 4.2 5.2 0.0 2.1 0.0  28 392 0.0 90.0 5.9 1.5 1.3 0.3 0.5 0.5
29 209 0.0 93.3 1.4 4.3 1.0 0.0    29 90   89.0 4.4 3.3 0.0 3.3 0.0  29 385 0.0 90.4 6.2 1.6 1.0 0.3 0.5 0.0
30 207 0.0 94.7 1.4 2.9 1.0 0.0    30 80   88.7 3.8 2.5 0.0 5.0 0.0  30 386 0.0 89.9 7.3 1.0 0.8 0.5 0.5 0.0
31 194 0.0 92.8 3.1 3.1 1.0 0.0    31 79   91.2 2.5 2.5 0.0 3.8 0.0  31 387 0.0 91.0 5.9 1.1 0.8 0.8 0.5 0.0
32 192 0.0 91.2 3.6 3.6 1.6 0.0    32 74   91.7 1.4 1.4 1.4 4.1 0.0  32 366 0.0 90.7 6.6 1.1 0.8 0.5 0.0 0.0
33 179 0.0 92.7 1.7 3.9 1.7 0.0    33 69   92.9 1.4 1.4 1.4 2.9 0.0  33 340 0.0 91.1 5.9 1.8 0.6 0.6 0.0 0.0
34 177 0.0 93.8 1.7 4.5 0.0 0.0    34 63   93.6 3.2 0.0 0.0 3.2 0.0  34 323 0.0 89.8 7.1 1.9 0.6 0.6 0.0 0.0
35 162 0.0 95.7 0.6 3.7 0.0 0.0    35 58   91.5 3.4 0.0 1.7 3.4 0.0  35 300 0.0 90.2 5.7 2.7 0.7 0.7 0.0 0.0
36 157 0.6 93.0 3.2 3.2 0.0 0.0    36 58   93.2 3.4 0.0 0.0 3.4 0.0  36 283 0.0 90.5 5.3 2.8 0.7 0.7 0.0 0.0
37 146 0.7 93.8 1.4 3.4 0.0 0.7    37 53   90.5 3.8 0.0 0.0 3.8 0.0  37 248 0.0 90.8 4.8 2.8 0.8 0.8 0.0 0.0
38 139 0.7 94.3 1.4 2.9 0.0 0.7    38 50   90.0 4.0 0.0 0.0 4.0 0.0  38 235 0.0 90.1 5.1 3.0 0.9 0.9 0.0 0.0
39 126 0.8 92.8 1.6 4.0 0.0 0.8                   39 218 0.0 89.0 5.5 3.2 1.4 0.9 0.0 0.0
40 125 0.8 92.8 1.6 4.0 0.0 0.8                   40 205 0.0 89.2 4.9 3.4 1.5 1.0 0.0 0.0
41 113 0.9 94.6 1.8 1.8 0.0 0.9                   41 190 0.0 90.5 4.7 2.6 1.1 1.1 0.0 0.0
42 111 0.9 94.6 1.8 1.8 0.0 0.9                   42 182 0.0 90.2 5.5 2.7 0.5 1.1 0.0 0.0
43 99 1.0 93.8 2.0 2.0 0.0 1.0                   43 154 0.6 89.7 5.8 2.6 0.0 1.3 0.0 0.0
44 84 1.2 95.2 1.2 1.2 0.0 1.2                   44 145 0.7 91.0 4.1 2.8 0.0 1.4 0.0 0.0
45 75 1.3 96.1 1.3 1.3 0.0 0.0                   45 128 0.8 91.3 4.7 1.6 0.0 1.6 0.0 0.0
46 75 1.3 96.1 1.3 1.3 0.0 0.0                   46 117 0.9 92.2 4.3 1.7 0.0 0.9 0.0 0.0
47 74 1.4 95.9 0.0 2.7 0.0 0.0                   47 113 0.9 92.0 4.4 1.8 0.0 0.9 0.0 0.0
48 71 1.4 97.2 0.0 1.4 0.0 0.0                   48 97 1.0 90.7 6.2 2.1 0.0 0.0 0.0 0.0
49 65 1.5 97.0 0.0 1.5 0.0 0.0                   49 93 2.2 90.2 5.4 2.2 0.0 0.0 0.0 0.0
X. No socio-sexual contacts or reactions
0. Exclusively heterosexual with no homosexual
1. Predominantly heterosexual, only incidentally homosexual
2. Predominantly heterosexual, but more than incidentally homosexual
3. Equally heterosexual and homosexual
4. Predominantly homosexual, but more than incidentally heterosexual
5. Predominantly homosexual, but incidentally heterosexual
6. Exclusively homosexual

These are active incidence figures for each rating at each age.
If the percentages are added from the right-hand side of each line,
the cumulated percents will show the portion of the population which rates 1 or more, or 2 or more, etc., in each age period.


Tables 141c-146c. Cumulated percents for heterosexual-homosexual ratings from Tables 141-146

Heterosexual-Homosexual Rating: Active Incidence

Age Single White Males
Grade School Level (0-8) High School Level (9-12) College Level (13+)
Cases 1 2 3 4 5 6 Age Cases 1 2 3 4 5 6 Age Cases 1 2 3 4 5 6
% % % % % % % % % % % % % % % % % %
5 820 5.1 5 4.6 3.1 2.9 2.8 5 631

4.8

4.5

4.2

3.4

3.1

2.9

5 2846

6.9

6.7

6.5

4.3

3.7

3.5

6 820 10 9.5 8.3 5.5 5.3 5.2 6 631

9.6

8.8

8

5.8

5.3

5.1

6 2846

9.8

9.5

8.9

5.9

5.2

5

7 819 14 12.5 10.3 7.1 6.2 6 7 631

13.3

12.2

10.5

7.5

6.4

6.2

7 2846

12.5

12.2

11.5

8.4

7.4

6.9

8 819 20.1 18.3 14.8 10.5 9.8 9.4 8 631

17.1

16.1

13.9

10.3

9.2

8.9

8 2846

17.4

16.9

15.7

11.6

10.4

9.8

9 819 22.9 21.1 16.8 12.2 11.5 11 9 631

21.6

20.5

17.8

13

11.9

11.6

9 2846

18.7

18.1

16.8

12.5

11.2

10.6

10 819 28.6 26.4 21.3 15.4 14.4 13.9 10 631

28.8

27.1

23.9

18.4

17

16.5

10 2846

19.3

18.4

16.5

16.5

14.8

14.1

11 818 30.1 27.8 22.4 16 14.9 14.4 11 631

31.3

28.1

24

18.5

17.1

16

11 2846

25.9

24.8

22.7

17.7

15.8

15

12 815 32.6 29.8 23.3 16.2 15 14.4 12 631

35

31

25.5

19.5

17.3

16.2

12 2846

28.8

27.4

24.9

19.7

17.3

16.3

13 814 29.4 27.1 21.4 15.4 13.8 12.9 13 631

33.6

29.6

24.4

18.4

16.2

14.6

13 2846

25.7

23.8

21.3

16.2

13.2

11.8

14 811 27.4 25.7 20.4 14.1 12 10.6 14 631

31.6

28

22.5

17.7

14.7

11.7

14 2846

22.4

19.4

16.4

12.7

9.7

8.2

15 803 25.9 23.2 17 11.9 9.2 7.7 15 629

31.5

27.2

20.7

15.9

11.3

7.8

15 2846

18.6

15.3

12.4

9.6

6.9

5.5

16 774 25.8 22.1 14.5 9.5 6.4 5 16 619

34.1

27.6

19.5

14.8

10.1

6.5

16 2843

17.3

13.3

10.3

7.8

5.3

3.6

17 708 26.1 22.1 14 8.9 5.8 4.4 17 577

38.9

31.6

20.5

16

10.8

6.8

17 2839

15.4

11.5

8.7

6.7

4.5

2.8

18 635 26.9 22.3 14.4 8.7 6.3 4.6 18 502

40.4

33.8

23

17

11.6

7

18 2755

10

10

7.5

5.9

4.1

2.3

19 550 26.8 22.3 14.3 8.3 5.8 4.5 19 420

42.4

35.5

23.8

18.8

13.6

7.6

19 2579

14.9

9.7

7.4

5.8

4

2.2

20 473 25.6 22.4 14.8 9.1 6.6 5.1 20 350

41

35.6

24.7

20.1

15.2

8.6

20 2306

15.5

9.9

7.3

6

4.2

2.3

21 386 28.2 24.1 16.3 9.6 6.7 4.4 21 274

41.6

35

26.2

22.6

16.8

9.5

21 1961

15

9.8

7.3

6.3

4.4

2.4

22 306 28.3 24.1 17.2 9.4 6.8 4.2 22 232

41.8

34.9

26.7

22.8

17.6

10.3

22 1527

16.4

11

8.7

7.7

5.5

3.1

23 269 30.1 25.6 17.4 10 6.7 4.1 23 197

43.1

36

29.9

24.8

17.7

8.6

23 1201

12.9

8.4

6.2

5.3

2.9

3,7

24 231 31.6 27.3 18.2 10 6.5 5.2 24 166

46.8

39

32.4

26.4

18

9.6

24 895

19.3

14.2

12.1

10.8

7.4

4.4

25 187 35.3 28.3 19.2 10.1 6.9 5.3 25 140

48.5

42.1

36.4

30.7

21.4

10.7

25 687

21.2

15.7

13.4

12.1

8.8

4.7

26 172 37.2 31.4 21.5 11 7.5 5.8 26 125

48

41.6

36

33.6

23.2

13.6

26 517

24.4

18.6

15.7

14.3

11.2

6.2

27 152 40.1 32.9 22.4 11.2 7.9 5.3 27 113

46.8

40.6

36.2

32.7

23.9

14.2

27 381

28

20.9

19.1

17.8

13.9

8.4

28 134 42.5 36.5 25.3 11.9 8.2 6.7 28 97

46.5

41.3

39.2

36.1

23.7

14.4

28 303

28.7

22.1

21.8

20.1

16.5

9.9

29 121 43 37.2 24.8 11.6 7.5 5.8 29 82

50

42.7

40.3

36.6

25.6

17.1

29 240

28.4

23.4

23

21.7

19.6

12.1

30 107 44.9 38.4 27.2 14.1 9.4 7.5 30 67

52.3

43.3

40.3

37.3

26.9

17.9

30 179

30.8

26.3

25.7

25.1

22.3

12.8

31 95 43.2 37.9 29.5 17.9 10.5 6.3 31 58 51.7 44.8 39.6 36.2 29.3 20.7 31 140

29.4

25.8

25.1

25.1

22.2

14.3

32 87 43.5 37.8 29.8 18.3 12.6 8             32 119

30.2

26

25.2

25.2

21.8

13.4

33 78 41 35.9 25.6 14.1 11.5 6.4             33 100

34

29

28

28

24

17

34 72 39 37.6 26.5 14 11.2 5.6             34 80

37.5

32.5

32.5

32.5

27.5

20

35 68 38.3 36.8 25 11.8 10.3 4.4             35 71

38

32.4

32.4

31

28.2

19.7

36 65 38.4 36.9 26.1 12.3 10.8 6.2             36 58

44.7

39.5

39.5

37.8

34.4

24.1

37 59 40.8 39.1 27.2 11.9 10.2 6.8             37 56

44.7

39.3

39.3

37.5

33.9

23.2

38 57 40.4 38.6 26.3 10.5 10.5 7             38 51

43.1

39.2

39.2

39.2

35.3

25.5

39 50 34 32 24 6 6 6                        
Age Married White Males
Grade School Level (0-8) High School Level (9-12) College Level (13+)
Cases 1 2 3 4 5 6 Age Cases 1 2 3 4 5 6 Age Cases 1 2 3 4 5 6
% % % % % % % % % % % % % % % % % %
18 68

14.7

10.3

2.90

0

00.0 00.0 18 51

15.7

11.8

2.00

00.0

00.0

00.0            
19 103

8.7

6.8

2.9

0

   19 73

15.1

11

6.9

2.8

1.4

             
20 134

9.7

7.5

4.5

0

   20 84

16.8

12

7.2

2.4

1.2

  20 59

3.40

3.40

00.0

00.0

00.0

00.0

21 181

9.9

7.7

2.2

0

   21 99

20

16

7

1

0

  21 97

8.3

3.1

1

0

0

0

22 223

11.2

7.6

1.8

0

   22 101

14.9

13.9

6

1

0

  22 172

9.9

4.1

1.8

1.2

1.2

0

23 222

8.2

5.9

1.8

0

   23 104

15.3

13.4

3.8

0

0

  23 221

9.1

4.6

2.8

1.4

0.5

0

24 228

8.8

5.7

2.2

0

   24 102

9.8

7.8

2.9

0

0

  24 278

7.7

4.1

1.9

1.2

0.8

0.4

25 238

8

6.3

2.1

0.40

   25 107

7.5

5.6

0.9

0

0

  25 330

8.7

3.9

2.1

1.2

0.6

0.3

26 223

4

2.2

0.4

0

   26 107

9.4

7.5

1.9

0

0

  26 378

6.6

2.4

1.6

1.1

0.6

0.3

27 232

7.3

3.9

0.9

0

   27 99

9

7

2

2

0

  27 391

8.5

2.6

2.1

1.3

1

0.5

28 232

7.3

5.1

0.4

0

   28 96

11.5

7.3

2.1

2.1

0

  28 392

10

4.1

2.6

1.3

1

0.5

29 209

6.7

5.3

1

0

   29 90

11

6.6

3.3

3.3

0

  29 385

9.6

3.4

1.8

0.8

0.5

0

30 207

5.3

3.9

1

0

   30 80

11.3

7.5

5

5

0

  30 386

10.1

2.8

1.8

1

0.5

0

31 194

7.2

4.1

1

0

   31 79

8.8

6.3

3.8

3.8

0

  31 387

9.1

3.2

2.1

1.3

0.5

0

32 192

8.8

5.2

1.6

0

   32 74

8.3

6.9

5.5

4.1

0

  32 366

9

2.4

1.3

0.5

0

0

33 179

7.3

5.6

1.7

0

   33 69

7.1

5.7

4.3

2.9

0

  33 340

8.9

3

1.2

0.6

0

0

34 177

6.2

4.5

0

0

   34 63

6.4

3.2

3.2

3.2

0

  34 323

10.2

3.1

1.2

0.6

0

0

35 162

4.3

3.7

0

0

   35 58

8.5

5.1

5.1

3.4

0

  35 300

9.8

4.1

1.4

0.7

0

0

36 157

6.4

3.2

0

0

   36 58

6.8

3.4

3.4

3.4

0

  36 283

9.5

4.2

1.4

0.7

0

0

37 146

5.5

4.1

0.7

0.7

   37 53

7.6

3.8

3.8

3.8

0

  37 248

9.2

4.4

1.6

0.8

0

0

38 139

5

3.6

0.7

0.7

   38 50 8.0 4.0 4.0 4.0 0.0  38 235

9.9

4.8

1.8

0.9

0

0

39 126

6.4

4.8

0.8

0.8

               39 218

11

5.5

2.3

0.9

0

0

40 125

6.4

4.8

0.8

0.8

               40 205

10.8

5.9

2.5

1

0

0

41 113

4.5

2.7

0.9

0.9

               41 190

9.5

4.8

2.2

1.1

0

0

42 111

4.5

2.7

0.9

0.9

               42 182

9.8

4.3

1.6

1.1

0

0

43 99

5

3

1

1

               43 154

9.7

3.9

1.3

1.3

0

0

44 84

3.6

2.4

1.2

1.2

               44 145

8.3

4.2

1.4

1.4

0

0

45 75

2.6

1.3

0

0

               45 128

7.9

3.2

1.6

1.6

0

0

46 75

2.6

1.3

0

0

               46 117

6.9

2.6

0.9

0.9

0

0

47 74

2.7

2.7

0

0

               47 113

7.1

2.7

0.9

0.9

0

0

48 71

1.4

1.4

0

0

               48 97

8.3

2.1

0

0

0

0

49 65 1.5 1.5 0.0 0.0                49 93 7.6 2.2 0.0 0.0 0.0 0.0
X. No socio-sexual contacts or reactions
0. Exclusively heterosexual with no homosexual
1. Predominantly heterosexual, only incidentally homosexual
2. Predominantly heterosexual, but more than incidentally homosexual
3. Equally heterosexual and homosexual
4. Predominantly homosexual, but more than incidentally heterosexual
5. Predominantly homosexual, but incidentally heterosexual
6. Exclusively homosexual

Based on Tables 141-146.
Cumulated percents show the portion of the population which rates 1 or more, or 2 or more, etc., in each age period.


Table 148. Cumulated percents of heterosexual-homosexual ratings
Age Cases Heterosexual-Homosexual Rating: Active Incidence
Cumulated Percents
X 0+ 1+ 2+ 3+ 4+ 5+ 6+
Single Males—Educ. Level 0-8
    % % % % % % % %
15 803 32.0 42.1 25.9 23.2 17.0 11.9 9.2 7.7
20 473 9.3 65.1 25.6 22.4 14.8 9.1 6.6 5.1
25 187 4.8 59.9 35.3 28.3 19.2 10.1 6.9 5.3
30 107 1.9 53.2 44.9 38.4 27.2 14.1 9.4 7.5
35 68 2.9 58.8 38.3 36.8 25.0 11.8 10.3 4.4
Single Males—Educ. Level 9-12
15 629 19.9 48.6 31.5 27.2 20.7 15.9 11.3 7.8
20 350 2.0 57.0 41.0 35.6 24.7 20.1 15.2 8.6
25 140 0.7 50.8 48.5 42.1 36.4 30.7 21.4 10.7
30 67 1.5 46.2 52.3 43.3 40.3 37.3 26.9 17.9
Single Males—Educ. Level 13+
15 2846 22.3 59.1 18.6 15.3 12.4 9.6 6.9 5.5
20 2306 3.9 80.6 15.5 9.9 7.3 6.0 4.2 2.3
25 687 3.3 75.5 21.2 15.7 13.4 12.1 8.8 4.7
30 179 4.5 64.7 30.8 26.3 25.7 25.1 22.3 12.8
35 71 7.0 55.0 38.0 32.4 32.4 31.0 28.2 19.7
Married Males —Educ. Level 0-8
20 134 0.0 90.3 9.7 7.5 4.5 0.0 0.0 0.0
25 238 0.0 92.0 8.0 6.3 2.1 0.4 0.0 0.0
30 207 0.0 94.7 5.3 3.9 1.0 0.0 0.0 0.0
35 162 0.0 95.7 4.3 3.7 0.0 0.0 0.0 0.0
40 125 0.8 92.8 6.4 4.8 0.8 0.8 0.0 0.0
45 75 1.3 96.1 2.6 1.3 0.0 0.0 0.0 0.0
Married Males—Educ. Level 13 +
20 59 0.0 96.6 3.4 3.4 0.0 0.0 0.0 0.0
25 330 0.0 91.3 8.7 3.9 2.1 1.2 0.6 0.3
30 386 0.0 89.9 10.1 2.8 1.8 1.0 0.5 0.0
35 300 0.0 90.2 9.8 4.1 1.4 0.7 0.0 0.0
40 205 0.0 89.2 10.8 5.9 2.5 1.0 0.0 0.0
45 128 0.8 91.3 7.9 3.2 1.6 1.6 0.0 0.0
Total Population: Single, Married—All Educ. Levels
15 4284 23.6 48.4 28.0 24.4 18.4 13.7 10.0 7.4
20 3467 3.3 69.3 27.4 23.0 15.6 11.2 8.3 4.9
25 1835 1.0 79.2 19.8 15.9 10.8 7.6 5.2 2.9
30 1192 0.5 83.1 16.4 12.4 9.0 6.9 3.9 2.6
35 844 0.4 86.7 12.9 10.5 7.1 5.2 3.5 2.6
40 576 1.3 86.8 11.9 8.9 5.3 3.3 2.6 2.3
45 382 2.7 88.8 8.5 6.2 4.2 2.9 2.0 1.8
X. No socio-sexual contacts or reactions
0. Exclusively heterosexual with no homosexual
1. Predominantly heterosexual, only incidentally homosexual
2. Predominantly heterosexual, but more than incidentally homosexual
3. Equally heterosexual and homosexual
4. Predominantly homosexual, but more than incidentally heterosexual
5. Predominantly homosexual, but incidentally heterosexual
6. Exclusively homosexual

Based on Tables 141-146, 147, cumulated from the right-hand end of each line.
Data for adult males (at ages 15, 20, 25, 30, etc.),
for single and married groups of each educational level and of total population.
Shows percent of each group which rates 1 or more, 2 or more, 3 or more, etc., in each of the given years.


Tables 149-150. Heterosexual-homosexual ratings:
accumulative incidence
and cumulated percents for each rating
Age
Period
Cases
Heterosexual-Homosexual Ratings: Accumulative Incidence
All Males, Single and Married
Current Rating Accumulative Incidence
Highest Rating for any 3 years since 16
Cumulated Percents
Highest Ratings For Any 3 Years Since 16
X 0 1 2 3 4 5 6 1-6 2-6 3-6 4-6 5-6 6-6
Educ. Level 0-8
   % % % % % % % % % % % % % %
16-20 712 11.2 64.4 2.9 8.2 5.2 2.2 1.7 4.2 24.4 21.5 13.3 8.1 5.9 4.2
16-25 557 3.8 73.7 2.9 7.5 5.9 1.4 1.4 3.4 22.5 19.6 12.1 6.2 4.8 3.4
16-30 462 1.1 77.7 2.8 7.6 4.5 1.3 1.1 3.9 21.2 18.4 10.8 6.3 5.0 3.9
16-35 357 0.8 80.1 2.8 6.2 4.2 1.4 1.1 3.4 19.1 16.3 10.1 5.9 4.5 3.4
16-40 288 0.3 83.7 1.4 5.9 3.5 1.0 0.7 3.5 16.0 14.6 8.7 5.2 4.2 3.5
16-45 205 0.5 84.8 1.0 5.4 2.4 1.5 0.5 3.9 14.7 13.7 8.3 5.9 4.4 3.9
16-50 147 0.7 84.9 1.4 4.8 2.0 0.7 0.7 4.8 14.4 13.0 8.2 6.2 5.5 4.8
16-55 98 1.0 84.8 0.0 5.1 2.0 1.0 1.0 5.1 14.2 14.2 9.1 7.1 6.1 5.1
Educ. Level 9-12
16-20 584 2.7 61.2 5.3 10.4 4.8 5.0 3.4 7.2 36.1 30.8 20.4 15.6 10.6 7.2
16-25 347 0.9 63.4 4.9 8.1 4.9 4.9 4.0 8.9 35.7 30.8 22.7 17.8 12.9 8.9
16-30 238 0.4 67.2 4.6 5.9 3.4 4.2 3.4 10.9 32.4 27.8 21.9 18.5 14.3 10.9
16-35 148 0.0 70.3 4.7 6.1 3.4 2.7 2.0 10.8 29.7 25.0 18.9 15.5 12.8 10.8
16-40 92 0.0 72.8 4.3 4.3 3.3 3.3 1.1 10.9 27.2 22.9 18.6 15.3 12.0 10.9
16-45 61 0.0 77.1 3.3 3.3 1.6 3.3 1.6 9.8 22.9 19.6 16.3 14.7 11.4 9.8
Educ. Level 13+
16-20 2979 5.3 80.3 3.8 2.4 1.7 2.1 1.9 2.5 14.4 10.6 8.2 6.5 4.4 2.5
16-25 1635 2.1 80.1 4.3 2.5 1.3 2.9 2.7 4.1 17.8 13.5 11.0 9.7 6.8 4.1
16-30 876 1.4 77.8 4.6 2.1 1.7 2.6 3.4 6.4 20.8 16.2 14.1 12.4 9.8 6.4
16-35 552 1.1 80.7 4.2 2.4 1.1 2.5 2.0 6.0 18.2 14.0 11.6 10.5 8.0 6.0
16-40 375 0.5 81.4 4.5 1.3 0.8 2.1 2.2 7.2 18.1 13.6 12.3 11.5 9.4 7.2
16-45 218 0.5 82.1 6.0 1.8 0.9 0.9 1.8 6.0 17.4 11.4 9.6 8.7 7.8 6.0
16-50 132 0.0 87.1 4.5 2.3 1.5 0.8 0.0 3.8 12.9 8.4 6.1 4.6 3.8 3.8
16-55 74 0.0 86.5 4.1 2.7 1.3 1.3 0.0 4.1 13.5 9.4 6.7 5.4 4.1 4.1
Total Population—U. S. Correction
16-20 4275 5.7 64.8 4.4 8.6 4.5 3.7 2.7 5.6 29.5 25.1 16.5 12.0 8.3 5.6
16-25 2539 2.0 69.0 4.2 7.1 4.7 3.5 3.0 6.5 29.0 24.8 17.7 13.0 9.5 6.5
16-30 1576 0.8 72.7 3.9 6.0 3.6 2.9 2.5 7.6 26.5 22.6 16.6 13.0 10.1 7.6
16-35 1057 0.5 76.3 3.8 5.6 3.4 2.1 1.6 6.7 23.2 19.4 13.8 10.4 8.3 6.7
16-40 755 0.2 79.9 2.7 4.8 3.1 1.9 1.0 6.4 19.9 17.2 12.4 9.3 7.4 6.4
16-45 484 0.4 82.3 2.2 4.4 2.0 1.9 1.0 5.8 17.3 15.1 10.7 8.7 6.8 5.8
16-50 318 0.5 83.8 2.6 4.0 2.1 1.1 0.5 5.4 15.7 13.1 9.1 7.0 5.9 5.4
16-55 191 0.7 85.0 1.4 4.9 1.5 0.8 0.7 5.0 14.3 12.9 8.0 6.5 5.7 5.0
Total U. S. Population—Corrected for All Ages
16-55 4275 1.5 75.6          22.9 19.6 13.7 10.4 8.0 6.2
X. No socio-sexual contacts or reactions
0. Exclusively heterosexual with no homosexual
1. Predominantly heterosexual, only incidentally homosexual
2. Predominantly heterosexual, but more than incidentally homosexual
3. Equally heterosexual and homosexual
4. Predominantly homosexual, but more than incidentally heterosexual
5. Predominantly homosexual, but incidentally heterosexual
6. Exclusively homosexual
“Educ. level 0-8” are the males who never go beyond grade school.
“Educ. level 9-12” are the males who enter high school but never go beyond.
“Educ. level 13+” are the males who will ultimately go to college.

Showing percents of each population which have ever held the shown rating for at least three years
between 16 and the age shown in column 1.
By eliminating both preadolescent and early adolescent years from the calculations,
and by limiting the table to cases which have had at least three years of homosexual ratings,
the table has been limited to definitely adult and pronouncedly homosexual experience of the degree shown by each rating.
Cumulated percents are showing percents of each population which have rated “at least a 1,” “at least a 2,” “at least a 3,” etc.,
for at least 3 years between 16 and the age shown in column 1.
The final line of figures, for the total U. S. population corrected for all ages, shows
how many males in any population may be expected to have ratings of each sort.


>>