Table 59. Animal contacts and age of a male |
Age Group |
Cases | Animal contacts: Sample Population | Animal contacts: U. S. Population | ||||||||||
Total Population | Active Population | Total Population | Active Population | ||||||||||
Mean Frequency |
Me- dian Freq. |
% of Total Outlet |
Incid. % |
Mean Frequency |
Me- dian Freq. |
% of Total Outlet |
Mean Freq. |
% of Total Outlet |
Incid. % |
Mean Freq. |
% of Total Outlet | ||
Single Males | |||||||||||||
Adol.-15 | 3012 | 0.022 ± 0.005 | 0.00 | 0.78 | 5.9 | 0.38 ± 0.077 | 0.076 | 5.88 ± 0.90 | 0.023 | 0.74 | 5.9 | 0.39 | 6.92 |
16-20 | 2868 | 0.019 ± 0.005 | 0.00 | 0.66 | 3.5 | 0.54 ± 0.12 | 0.094 | 9.88 ± 1.57 | 0.029 | 0.87 | 4.2 | 0.69 | 11.96 |
21-25 | 1535 | 0.003 ± 0.002 | 0.00 | 0.13 | 1.0 | 0.32 ± 0.12 | 0.094 | 11.13 ± 3.71 | 0.003 | 0.11 | 1.2 | 0.28 | 14.70 |
26-30 | 550 | 0.002 ± 0.002 | 0.00 | 0.063 | 0.5 | 0.30 ± 0.25 | 0.10 | 4.67 ± 4.17 | 0.001 | 0.04 | 0.7 | 0.13 | 1.40 |
31-35 | 195 | .... | .... | .... | 2.1 | 0.30 ± 0.25 | .... | .... | .... | .... | .... | .... | .... |
In this, and in the succeeding charts in this and the following chapter, means and medians represent average frequencies per week. “% of Total Outlet” in the total population shows what portion of the total number of orgasms is derived from masturbation in the total population. A total of such figures for all the possible sources of outlet equals 100%, which is the total outlet of the group. “% of Total Outlet” for the active population represents the mean of the figures showing the percentage of the total outlet which is derived from this source by each individual who has any masturbation in his history, in that particular age period. The percents for the several possible outlets do not total 100% because different individuals are involved in the populations utilizing each type of outlet. |
|||||||||||||
U. S. population figures are corrections of the raw data for a population whose age, marital status, and educational level |
Table 124. Animal contacts and rural-urban background |
Age Group |
Rural- Urban Group |
Cases | Animal Contacts: Rural, Urban | |||||
Total Population | Active Population | |||||||
Mean Frequency |
Me- dian Freq. |
% of Total Outlet |
Incid. % |
Mean Frequency |
Me- dian Freq. | |||
Educational Level 0-8 | ||||||||
Adol.-15 | Rural | 245 | 0.054 ± 0.018 | 0.00 | 2.3 | 8.6 | 0.63 ± 0.16 | 0.50 |
Urban | 401 | 0.011 ± 0.006 | 0.00 | 0.3 | 4.0 | 0.28 ± 0.13 | 0.08 | |
16-20 | Rural | 259 | 0.034 ± 0.012 | 0.00 | 1.2 | 7.3 | 0.46 ± 0.13 | 0.26 |
Urban | 397 | 0.012 ± 0.008 | 0.00 | 0.3 | 2.0 | 0.58 ± 0.35 | 0.09 | |
Educational Level 9-12 | ||||||||
Adol.-15 | Rural | 124 | 0.038 ± 0.020 | 0.00 | 1.4 | 10.5 | 0.36 ± 0.17 | 0.10 |
Urban | 459 | 0.018 ± 0.008 | 0.00 | 0.5 | 3.7 | 0.48 ± 0.19 | 0.09 | |
16-20 | Rural | 124 | 0.092 ± 0.040 | 0.00 | 2.9 | 10.5 | 0.88 ± 0.32 | 0.40 |
Urban | 458 | 0.017 ± 0.010 | 0.00 | 0.5 | 2.6 | 0.65 ± 0.33 | 0.09 | |
21-25 | Rural | 50 | 0.013 ± 0.008 | 0.00 | 0.5 | 6.0 | 0.22 ± 0.08 | 0.30 |
Urban | 209 | 0.014 ± 0.013 | 0.00 | 0.5 | 1.9 | 0.74 ± 0.69 | 0,08 | |
Educational Level 13+ | ||||||||
Adol.-15 | Rural | 352 | 0.14 ± 0.039 | 0.00 | 4.7 | 27.8 | 0.49 ± 0.13 | 0.08 |
Urban | 2587 | 0.003 ± 0.001 | 0.00 | 0.1 | 1.9 | 0.14 ± 0.05 | 0.06 | |
16-20 | Rural | 363 | 0.070 ± 0.028 | 0.00 | 2.8 | 15.4 | 0.46 ± 0.18 | 0.10 |
Urban | 2640 | 0.001 ± 0.001 | 0.00 | 0.02 | 0.7 | 0.12 ± 0.07 | 0.06 | |
21-25 | Rural | 266 | 0.015 ± 0.008 | 0.00 | 0.7 | 3.8 | 0.40 ± 0.17 | 0.25 |
Urban | 1753 | 0.0001 ± 0.0004 | 0.00 | 0.002 | 0.1 | 0.05 | 0.08 | |
26-30 | Rural | 85 | 0.009 ± 0.009 | 0.00 | 0.4 | |||
Urban | 445 | 0.0002 ± 0.00011 | 0.00 | 0.0004 | 0.4 | 0.05 | 0.08 |
Table 151. Accumulative incidence data on animal contacts among rural males |
Age | Animal Contacts: Accumulative Incidence Data | |||||||
Total Population U. S. Corrections |
Educ. Level 0-8 |
Educ. Level 9-12 |
Educ. Level 13+ | |||||
Cases |
% with Exper. | Cases |
% with Exper.. | Cases |
% with Exper. | |
10 | 749 | 0.04 | 203 | 110 | 436 | 0.7 | ||
11 | 749 | 0.4 | 203 | 0.5 | 110 | 436 | 1.1 | |
12 | 749 | 3.7 | 203 | 4.4 | 110 | 2.7 | 436 | 4.8 |
13 | 749 | 5.7 | 203 | 5.9 | 110 | 4.5 | 436 | 10.8 |
14 | 749 | 8.1 | 203 | 8.4 | 110 | 6.4 | 436 | 17.2 |
15 | 749 | 10.4 | 203 | 9.9 | 110 | 9.1 | 436 | 22.7 |
16 | 745 | 12.2 | 201 | 10.0 | 109 | 12.8 | 435 | 25.5 |
17 | 728 | 12.8 | 190 | 10.0 | 105 | 14.3 | 433 | 26.1 |
18 | 700 | 15.4 | 179 | 13.4 | 93 | 16.1 | 428 | 26.6 |
19 | 646 | 15.9 | 166 | 13.9 | 79 | 16.5 | 401 | 26.4 |
20 | 567 | 16.5 | 145 | 14.5 | 63 | 17.5 | 359 | 26.2 |
21 | 500 | 14.0 | 128 | 14.1 | 51 | 11.8 | 321 | 28.0 |
22 | 366 | 15.0 | 101 | 12.9 | 265 | 29.4 | ||
23 | 290 | 16.7 | 76 | 15.8 | 214 | 29.0 | ||
24 | 253 | 17.2 | 67 | 14.9 | 186 | 28.0 | ||
25 | 217 | 60 | 13.3 | 157 | 27.4 | |||
26 | 176 | 50 | 12.0 | 126 | 25.4 | |||
27 | 96 | 96 | 24.0 | |||||
28 | 72 | 72 | 23.6 | |||||
29 | 59 | 59 | 23.7 | |||||
“Educ. level 0-8” are the males who never go
beyond grade school. “Educ. level 9-12” are the males who enter high school but never go beyond. “Educ. level 13+” are the males who will ultimately go to college. | ||||||||
Data confined to single males who lived on farms | ||||||||
| ||||||||
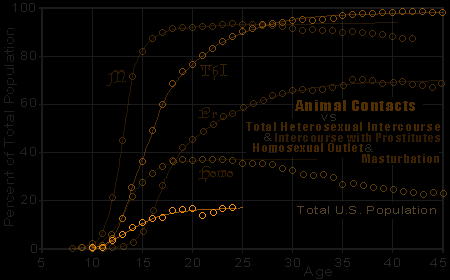
Figures 171-172. Animal contacts: accumulative incidence in total U. S. population and in three educational levels of single rural population. Vs. masturbation (M), premarital intercourse (P), and intercourse with prostitutes (I) | ||||||||
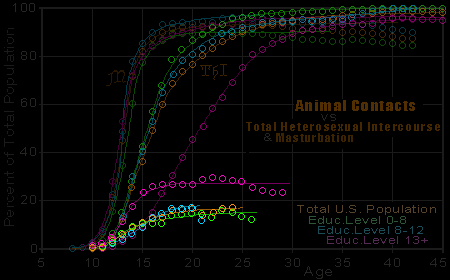
Showing percent of each level of single rural males who have ever had sexual contacts with animals |
Table 91. Animal contacts, as related to educational level |
Age Group | Educ. Level |
Cases | Animal Contacts, Single Males, by Educational Levels | |||||
Total Population | Active Population | Accum. Incid. % | ||||||
Mean Frequency |
%of Total Outlet |
Incid. % |
Mean Freq. |
Median Freq. | ||||
Adol.-15 | 0-8 | 712 | 0.026 ± 0.007 | 0 86 | 5.8 | 0.45 | 0.14 | 10 |
9-12 | 606 | 0.030 ± 0.009 | 0.91 | 5.9 | 0.50 | 0.16 | 9 | |
13 + | 2799 | 0.020 ± 0.005 | 0.71 | 5.3 | 0.37 | 0.07 | 23 | |
16-20 | 0-8 | 720 | 0.022 ± 0.007 | 0.68 | 4.0 | 0.54 | 0.17 | 14 |
9-12 | 607 | 0.038 ± 0.012 | 1.08 | 4.6 | 0.82 | 0.24 | 17 | |
13 + | 2861 | 0.010 ± 0.004 | 0.36 | 2.5 | 0.39 | 0.09 | 25 | |
21-25 | 0-8 | 361 | 0.005 ± 0.003 | 0.15 | 1.1 | 0.43 | 0.33 | 14 |
9-12 | 263 | 0.014 ± 0.010 | 0.47 | 2.7 | 0.51 | 0.10 | 20 | |
13 + | 1898 | 0.002 ±talign="center"> 0.09 | 0.7 | 0.32 | 0.10 | 26 | ||
Median frequencies for the total populations are uniformly 0.00. |
||||||||
“Educ. level 0-8” are the males who never go
beyond grade school. |
||||||||
The active population is almost wholly rural and the active frequencies |