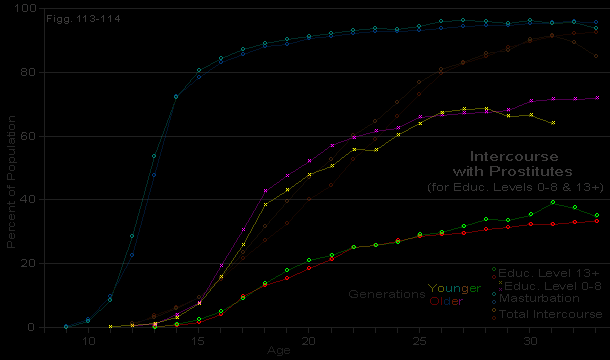
Table 138. Accumulative incidence data on total intercourse with prostitutes |
Age | Total Intercourse with Prostitutes: Accumulative Incidence Data | |||||||
Total Population U. S. Corrections |
Educ. Level 0-8 |
Educ. Level 9-12 |
Educ. Level 13+ | |||||
Cases |
% with Exper. | Cases |
% with Exper.. | Cases |
% with Exper. | |
8 | 3995 | 0.0 | 685 | 0.0 | 494 | 0.0 | 2816 | 0.0 |
9 | 3995 | 0.0 | 685 | 0.0 | 494 | 0.0 | 2816 | 0.0 |
10 | 3995 | 0.0 | 685 | 0.0 | 494 | 0.0 | 2816 | 0.0 |
11 | 3994 | 0.0 | 684 | 0.1 | 494 | 0.0 | 2816 | 0.0 |
12 | 3994 | 0.3 | 684 | 0.6 | 494 | 0.2 | 2816 | 0.0 |
13 | 3994 | 0.7 | 684 | 1.0 | 494 | 0.6 | 2816 | 0.1 |
14 | 3991 | 2.6 | 681 | 3.5 | 494 | 2.6 | 2816 | 0.8 |
15 | 3985 | 7.4 | 675 | 7.7 | 494 | 8.5 | 2816 | 2.3 |
16 | 3964 | 16.1 | 658 | 18.4 | 491 | 17.7 | 2815 | 4.8 |
17 | 3905 | 26.0 | 621 | 28.8 | 471 | 28.9 | 2813 | 9.1 |
18 | 3767 | 36.7 | 594 | 40.6 | 436 | 40.6 | 2737 | 13.6 |
19 | 3536 | 42.1 | 564 | 45.6 | 399 | 46.6 | 2573 | 17.4 |
20 | 3231 | 45.3 | 536 | 50.9 | 357 | 48.5 | 2338 | 20.6 |
21 | 2857 | 48.6 | 512 | 54.7 | 313 | 52.1 | 2032 | 22.2 |
22 | 2454 | 51.4 | 492 | 58.3 | 290 | 54.5 | 1672 | 24.9 |
23 | 2137 | 54.5 | 476 | 59.5 | 264 | 59.1 | 1397 | 25.7 |
24 | 1845 | 55.9 | 456 | 61.6 | 237 | 60.3 | 1152 | 26.6 |
25 | 1659 | 58.6 | 436 | 65.1 | 221 | 62.9 | 1002 | 28.6 |
26 | 1515 | 59.9 | 424 | 66.5 | 207 | 64.3 | 884 | 29.4 |
27 | 1379 | 61.2 | 409 | 67.5 | 196 | 65.8 | 774 | 30.5 |
28 | 1273 | 63.3 | 395 | 67.6 | 179 | 69.8 | 699 | 32.0 |
29 | 1164 | 64.0 | 371 | 67.7 | 159 | 71.1 | 634 | 32.0 |
30 | 1069 | 65.5 | 355 | 69.6 | 141 | 73.0 | 573 | 33.2 |
31 | 993 | 66.1 | 335 | 70.1 | 129 | 73.6 | 529 | 34.0 |
32 | 934 | 65.9 | 323 | 70.9 | 119 | 72.3 | 492 | 33.7 |
33 | 873 | 66.4 | 309 | 71.2 | 116 | 73.3 | 448 | 33.3 |
34 | 819 | 66.7 | 300 | 72.0 | 107 | 72.9 | 412 | 33.7 |
35 | 762 | 68.0 | 286 | 72.7 | 94 | 73.4 | 382 | 34.6 |
36 | 718 | 70.0 | 273 | 74.4 | 89 | 76.4 | 356 | 35.7 |
37 | 656 | 69.8 | 255 | 73.7 | 78 | 76.9 | 323 | 35.6 |
38 | 625 | 69.6 | 246 | 73.6 | 72 | 76.4 | 307 | 36.2 |
39 | 570 | 6«.2 | 224 | 72.3 | 66 | 74.2 | 280 | 36.4 |
40 | 521 | 68.8 | 204 | 73.5 | 60 | 71.7 | 257 | 36.6 |
41 | 485 | 68.9 | 192 | 74.0 | 55 | 70.9 | 238 | 37.0 |
42 | 456 | 68.1 | 183 | 73.8 | 52 | 69.2 | 221 | 35.3 |
43 | 409 | 67.2 | 167 | 73.1 | 50 | 68.0 | 192 | 34.4 |
44 | 379 | 66.8 | 154 | 72.7 | 177 | 36.2 | ||
45 | 348 | 68.7 | 141 | 73.0 | 161 | 38.5 | ||
“Educ. level 0-8” are the males who never go
beyond grade school. “Educ. level 9-12” are the males who enter high school but never go beyond. “Educ. level 13+” are the males who will ultimately go to college. | ||||||||
Covering the life span, including pre-marital, extra-marital, and post-marital histories. | ||||||||
| ||||||||
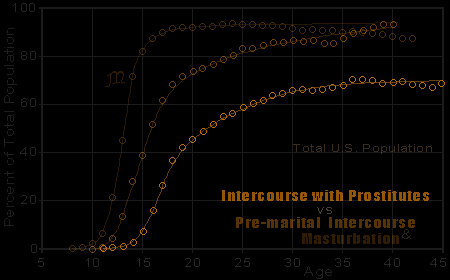
Figures 153-154. Intercourse with prostitutes: accumulative
incidence in total U. S. population and in three educational levels.. Vs.mstrbtn | ||||||||
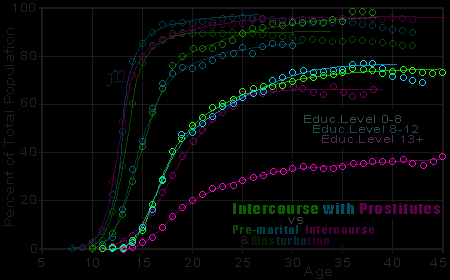
Showing percent of total population |
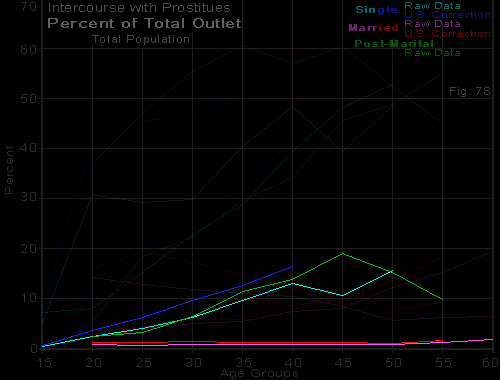
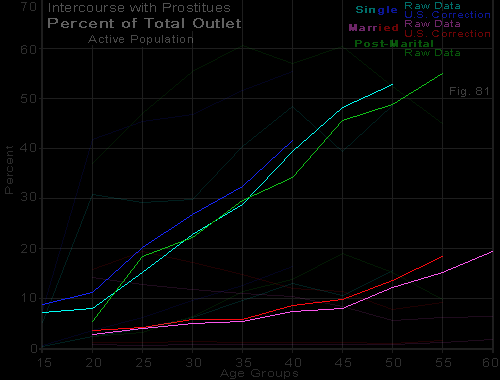
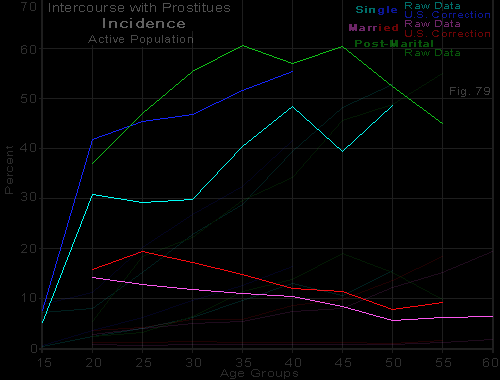
Table 55. Intercourse with prostitutes and age |
Age Group |
Cases | Intercourse with prostitutes: Sample Population |
Intercourse with prostitutes: U. S. Population |
||||||||||
Total population | Active Population | Total population |
Active Population | ||||||||||
Mean Frequency |
Me- dian Freq. |
% of Total Outlet |
Incid. % |
Mean Frequency |
Me- dian Freq. |
% of Total Outlet |
Mean Freq. |
% of Total Outlet |
Incid. % |
Mean Freq. |
% of Total Outlet |
||
Single Males | |||||||||||||
Adol.-15 | 3012 | 0.01 ± 0.00 | 0.00 | 0.39 | 5.2 | 0.21 ± 0.03 | 0.08 | 7.13 ± 1.34 | 0.02 | 0.61 | 7.7 | 0.25 | 8.79 |
16-20 | 2868 | 0.07 ± 0.01 | 0.00 | 2.48 | 30.8 | 0.23 ± 0.02 | 0.07 | 8.05 ± 0.60 | 0.12 | 3.66 | 41.9 | 0.29 | 11.24 |
21-25 | 1535 | 0.10 ± 0.01 | 0.00 | 3.92 | 29.1 | 0.35 ± 0.03 | 0.09 | 15.19 ± 1.21 | 0.20 | 6.29 | 45.5 | 0.43 | 20.27 |
26-30 | 550 | 0.16 ± 0.02 | 0.00 | 6.14 | 29.8 | 0.53 ± 0.06 | 0.25 | 22.82 ± 2.23 | 0.28 | 9.56 | 46.8 | 0.61 | 26.88 |
31-35 | 195 | 0.22 ± 0.04 | 0.00 | 9.67 | 40.5 | 0.55 ± 0.08 | 0.27 | 28.73 ± 3.36 | 0.31 | 12.57 | 51.6 | 0.62 | 32.38 |
36-40 | 97 | 0.26 ± 0.05 | 0.00 | 13.03 | 48.5 | 0.54 ± 0.09 | 0.32 | 39.49 ± 5.17 | 0.31 | 16.42 | 55.5 | 0.55 | 41.64 |
41-45 | 56 | 0.18 ± 0.05 | 0.00 | 10.65 | 39.3 | 0.47 ± 0.10 | 0.33 | 48.23 ± 7.93 | .... | .... | .... | .... | .... |
46-50 | 39 | 0.29 ± 0.11 | 0.00 | 15.77 | 48.7 | 0.60 ± 0.20 | 0.27 | 52.74 ± 8.96 | .... | .... | .... | .... | .... |
Married Males | |||||||||||||
16-20 | 272 | 0.04 ± 0.02 | 0.00 | 0.87 | 14.3 | 0.28 ± 0.11 | 0.07 | 2.87 ± 1.15 | 0.05 | 1.17 | 15.9 | 0.36 | 3.58 |
21-25 | 751 | 0.03 ± 0.01 | 0.00 | 0.72 | 12.9 | 0.21 ± 0.05 | 0.07 | 4.03 ± 0.96 | 0.05 | 1.15 | 19.5 | 0.25 | 4.29 |
26-30 | 737 | 0.03 ± 0.01 | 0.00 | 0.82 | 11.8 | 0.23 ± 0.04 | 0.07 | 4.95 ± 1.02 | 0.04 | 1.30 | 17.2 | 0.27 | 5.89 |
31-35 | 569 | 0.02 ± 0.01 | 0.00 | 0.84 | 11.1 | 0.20 ± 0.04 | 0.08 | 5.42 ± 1.19 | 0.03 | 1.12 | 14.9 | 0.18 | 5.76 |
36-40 | 390 | 0.02 ± 0.01 | 0.00 | 0.85 | 10.5 | 0.20 ± 0.04 | 0.08 | 7.33 ± 2.33 | 0.02 | 1.12 | 12.0 | 0.22 | 8.52 |
41-45 | 272 | 0.02 ± 0.00 | 0.00 | 0.78 | 8.5 | 0.18 ± 0.04 | 0.09 | 8.00 ± 3.75 | 0.02 | 1.11 | 11.4 | 0.19 | 9.84 |
46-50 | 175 | 0.01 ± 0.00 | 0.00 | 0.80 | 5.7 | 0.25 ± 0.07 | 0.22 | 12.25 ± 7.94 | 0.02 | 1.01 | 7.9 | 0.24 | 13.58 |
51-55 | 109 | 0.02 ± 0.01 | 0.00 | 1.13 | 7.3 | 0.24 ± 0.09 | 0.17 | 15.19 ± 10.73 | 0.02 | 1.65 | 9.1 | 0.25 | 18.43 |
56-60 | 67 | 0.02 ± 0.01 | 0.00 | 1.75 | 7.5 | 0.25 ± 0.15 | 0.10 | 19.50 ± 18.35 | .... | .... | .... | .... | ..... |
In this, and in the succeeding charts in this and the following chapter, means and medians represent average frequencies per week. “% of Total Outlet” in the total population shows what portion of the total number of orgasms is derived from masturbation in the total population. A total of such figures for all the possible sources of outlet equals 100%, which is the total outlet of the group. “% of Total Outlet” for the active population represents the mean of the figures showing the percentage of the total outlet which is derived from this source by each individual who has any masturbation in his history, in that particular age period. The percents for the several possible outlets do not total 100% because different individuals are involved in the populations utilizing each type of outlet. |
|||||||||||||
U. S. population figures are corrections of the raw data for a population whose age, marital status, and educational level |
Table 65. Intercourse with prostitutes in relation to marital status and age |
Age Group |
Total Sample Population | |||||||||
Cases | Mean Frequency | % of Total Outlet | ||||||||
Pre- mar- ital |
Extra- mar- ital |
Post- mar- ital |
Pre- mar- ital |
Extra- mar- ital |
Post- mar ital |
Pre- mar- ital |
Extra- mar- ital |
Post- mar- ital |
||
Adol.-15 | 3012 | 0.01 | 0.39 | |||||||
16-20 | 2868 | 272 | 46 | 0.07 | 0.04 | 0.10 | 2.48 | 0.87 | 2.37 | |
21-25 | 1535 | 751 | 119 | 0.10 | 0.03 | 0.12 | 3.92 | 0.72 | 3.25 | |
26-30 | 550 | 737 | 182 | 0.16 | 0.03 | 0.19 | 6.14 | 0.82 | 6.46 | |
31-35 | 195 | 569 | 158 | 0.22 | 0.02 | 0.22 | 9.67 | 0.84 | 11.34 | |
36-40 | 97 | 390 | 128 | 0.26 | 0.02 | 0.24 | 13.03 | 0.85 | 13.81 | |
41-45 | 56 | 272 | 96 | 0.18 | 0.02 | 0.28 | 10.65 | 0.78 | 18.96 | |
46-50 | 39 | 175 | 63 | 0.29 | 0.01 | 0.19 | 15.77 | 0.80 | 15.25 | |
51-55 | 109 | 42 | 0.02 | 0.12 | 1.13 | 9.78 | ||||
56-60 | 67 | 0.02 | 1.75 | |||||||
Age Group |
Active Cases in Sample Population | |||||||||
Incidence % | Mean Frequency | % of Total Outlet | ||||||||
Pre- mar ital |
Extra- mar ital |
Post- mar ital |
Pre- mar ital |
Extra- mar ital |
Post- mar ital |
Pre- mar ital |
Extra- mar ital |
Post- mar ital |
||
Adol.-15 | 5.2 | 0.21 | 7.13 | |||||||
16-20 | 30.8 | 14.3 | 37.0 | 0.23 | 0.28 | 0.26 | 8.05 | 2.87 | 5.50 | |
21-25 | 29.1 | 12.9 | 47.1 | 0.35 | 0.21 | 0.25 | 15.19 | 4.03 | 18.36 | |
26-30 | 29.8 | 11.8 | 55.5 | 0.53 | 0.23 | 0.34 | 22.82 | 4.95 | 22.28 | |
31-35 | 40.5 | 11.1 | 60.8 | 0.55 | 0.20 | 0.37 | 28.73 | 5.42 | 28.63 | |
36-40 | 48.5 | 10.5 | 57.0 | 0.54 | 0.20 | 0.41 | 39.49 | 7.33 | 34.23 | |
41-45 | 39.3 | 8.5 | 60.4 | 0.47 | 0.18 | 0.46 | 48.23 | 8.00 | 46.92 | |
46-50 | 48.7 | 5.7 | 52.4 | 0.60 | 0.25 | 0.37 | 52.74 | 12.25 | 48.83 | |
51-55 | 7.3 | 40.5 | 0.24 | 0.29 | 15.19 | 54.91 | ||||
56-60 | 7.5 | 0.25 | 19.50 | |||||||
Age Group |
Corrected for U. S. Population | |||||||||
Total Population | Active Population | |||||||||
Mean Frequency |
% of Total Outlet |
Incidence % |
Mean Frequency |
% of Total Outlet |
||||||
Pre- mar- ital |
Extra- mar- ital |
Pre- mar- ital |
Extra- mar- ital |
Pre- mar- ital |
Extra- mar- ital |
Pre- mar- ital |
Extra- mar- ital |
Pre- mar- ital |
Extra- mar- ital |
|
Adol.-15 | 0.02 | 0.61 | 7.7 | 0.25 | 8.79 | |||||
16-20 | 0.12 | 0.05 | 3.66 | 1.17 | 41.9 | 15.9 | 0.29 | 0.36 | 11.24 | 3.58 |
21-25 | 0.20 | 0.05 | 6.29 | 1.15 | 45.5 | 19.5 | 0.43 | 0.25 | 20.27 | 4.29 |
26-30 | 0.28 | 0.04 | 9.56 | 1.30 | 46.8 | 17.2 | 0.61 | 0.27 | 26.88 | 5.89 |
31-35 | 0.31 | 0.03 | 12.57 | 1.12 | 51.6 | 14.9 | 0.62 | 0.18 | 32.38 | 5.76 |
36-40 | 0.31 | 0.02 | 16.42 | 1.12 | 55.5 | 12.0 | 0.55 | 0.22 | 41.64 | 8.52 |
41-45 | 0.02 | 1.11 | 11.4 | 0.19 | 9.84 | |||||
46-50 | 0.02 | 1.01 | 7.9 | 0.24 | 13.58 | |||||
51-55 | 0.02 | 1.65 | 9.1 | 0.25 | 18.43 | |||||
Data for the U. S. population are based on the sample population |
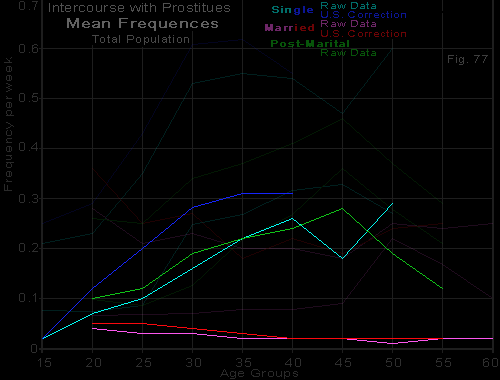
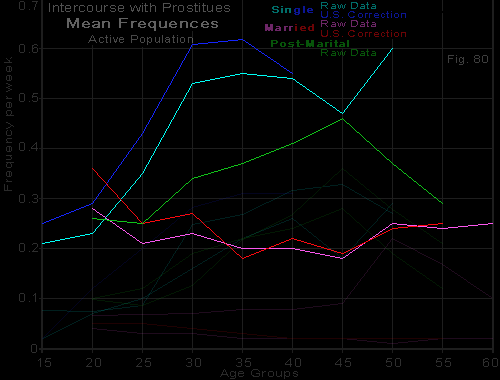
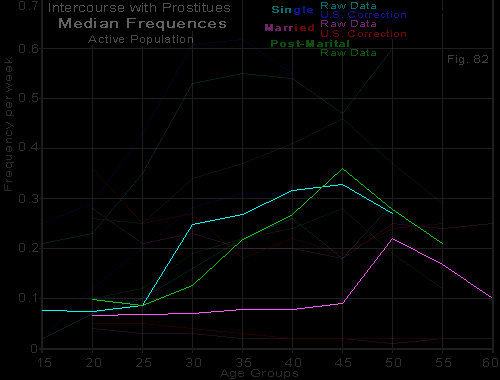
Figures 77-82. Relation of age and marital status to intercourse with prostitutes |
Table 87. Intercourse with prostitutes, as related to educational level |
Age Group |
Educ. Level |
Cases | Masturbation, by Educational Levels | |||||
Total Population | Active Population | Accum. Incid. % | ||||||
Mean Frequency |
%of Total Outlet |
Incid. % |
Mean Freq. |
Median Freq. | ||||
Single Males: Pre-marital Intercourse | ||||||||
Adol.-15 | 0-8 | 712 | 0.029 ± 0.007 | 0.97 | 8.7 | 0.33 | 0.10 | 8 |
9-12 | 606 | 0.014 ± 0.004 | 0.44 | 7.9 | 0.18 | 0.07 | 8 | |
13 + | 2799 | 0.003 ± 0.001 | 0.11 | 2.3 | 0.13 | 0.07 | 2 | |
16-20 | 0-8 | 720 | 0.20 ± 0.019 | 6.21 | 48.2 | 0.41 | 0.14 | 51 |
9-12 | 607 | 0.096 ± 0.011 | 2.75 | 41.4 | 0.23 | 0.08 | 44 | |
13 + | 2861 | 0.022 ± 0.002 | 0.80 | 19.3 | 0.11 | 0.06 | 20 | |
21-25 | 0-8 | 361 | 0.39 ± 0.045 | 12.55 | 60.7 | 0.64 | 0.33 | 74 |
9-12 | 263 | 0.14 ± 0.02 | 4.66 | 43.7 | 0.31 | 0.10 | 54 | |
13 + | 1898 | 0.03 ± 0.007 | 1.27 | 17.2 | 0.18 | 0.07 | 28 | |
26-30 | 0-8 | 159 | 0.41 ± 0.08 | 14.34 | 72.3 | 0.56 | 0.37 | 80 |
9-12 | 117 | 0.18 ± 0.04 | 6.46 | 42.7 | 0.43 | 0.17 | 61 | |
13 + | 487 | 0.08 ± 0.035 | 3.16 | 16.4 | 0.49 | 0.08 | 35 | |
Married Males: Extra-marital Intercourse | ||||||||
16-20 | 0-8 | 158 | 0.029 ± 0.012 | 0.61 | 16.5 | 0.18 | 0.07 | 17 |
9-12 | 87 | 0.074 ± 0.048 | 1.48 | 16.1 | 0.46 | 0.07 | 16 | |
13 + | 46 | 0.002 ± 0.001 | 0.05 | 4.3 | 0.05 | 0.08 | 4 | |
21-25 | 0-8 | 324 | 0.032 ± 0.009 | 0.80 | 15.1 | 0.21 | 0.08 | 18 |
9-12 | 164 | 0.061 ± 0.023 | 1.49 | 25.0 | 0.25 | 0.06 | 25 | |
13 + | 440 | 0.008 ± 0.003 | 0.23 | 5.2 | 0.16 | 0.07 | 6 | |
26-30 | 0-8 | 292 | 0.040 ± 0.011 | 1.16 | 17.1 | 0.24 | 0.08 | 20 |
9-12 | 135 | 0.053 ± 0.021 | 1.49 | 20.0 | 0.26 | 0.07 | 25 | |
13+ | 532 | 0.006 ± 0.002 | 0.20 | 6.0 | 0.10 | 0.07 | 7 | |
31-35 | 0-8 | 186 | 0.037 ± 0.012 | 1.46 | 15.6 | 0.24 | 0.09 | 20 |
9-12 | .82 | 0.033 ± 0.017 | 0.99 | 17.1 | 0.19 | 0.08 | 25 | |
13+ | 301 | 0.011 ± 0.004 | 0.41 | 6.6 | 0.16 | 0.08 | 8 | |
36-40 | 0-8 | 143 | 0.021 ± 0.007 | 0.93 | 9.8 | 0.21 | 0.13 | 21 |
9-12 | 58 | 0.044 ± 0.024 | 1.69 | 19.0 | 0.23 | 0.09 | ||
13+ | 189 | 0.013 ± 0.005 | 0.53 | 8.5 | 0.16 | 0.08 | 12 | |
41-45 | 0-8 | 100 | 0.028 ± 0.01 | 1.46 | 11.0 | 0.25 | 0.23 | 21 |
9-12 | 34 | 0.015 ± 0.009 | 0.70 | 14.7 | 0.10 | 0.08 | ||
13 + | 138 | 0.006 ± 0.003 | 0.32 | 5.1 | 0.12 | 0.08 | 12 | |
Median frequencies for the total populations are, for the most part, 0.00. | ||||||||
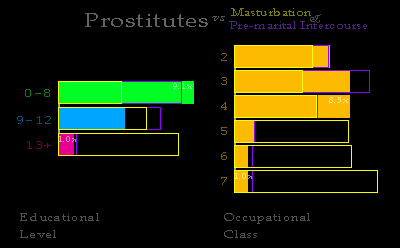
Figure 102. Pre-marital intercourse with prostitutes, by educational level and occupational class |
||||||||
“Educ. level 0-8” are the males who never go
beyond grade school. |
||||||||
Occupational Class: 0. Dependents 1. Underworld 2. Day labor 3. Semi-skilled labor 4. Skilled labor 5. Lower white collar group 6. Upper white collar group 7. Professional group 8. Business executive group 9. Extremely wealthy group |
||||||||
For single males of the age group 16-20. |
Table 100. Comparisons of older and younger generations: homosexual outlet, and intercourse with prostitutes |
Age | Accumulative Incidence, Two Generations | |||||||||||
Homosexual Outlet Educ. Level 13+ |
Intercourse with Prostitutes Educ. Level 13+ |
Intercourse with Prostitutes Educ. Level 0-8 | ||||||||||
Older Generation |
Younger Generation |
Older Generation |
Younger Generation |
Older Generation |
Younger Generation | |||||||
Cases | % with Exper. | Cases | % with Exper. | Cases | % with Exper. | Cases | % with Exper. | Cases | % with Exper. | Cases | % with Exper. | |
8 | 382 | 0.0 | 2435 | 0.0 | 382 | 0.0 | 2434 | 0.0 | 324 | 0.0 | 476 | 0.0 |
9 | 382 | 0.3 | 2435 | 0.0 | 382 | 0.0 | 2434 | 0.0 | 324 | 0.0 | 476 | 0.0 |
10 | 382 | 1.3 | 2435 | 0.3 | 382 | 0.0 | 2434 | 0.0 | 324 | 0.0 | 476 | 0.0 |
11 | 382 | 3.7 | 2435 | 1.6 | 382 | 0.0 | 2434 | 0.0 | 324 | 0.0 | 475 | 0.2 |
12 | 382 | 7.6 | 2435 | 6.0 | 382 | 0.0 | 2434 | 0.0 | 324 | 0.6 | 475 | 0.6 |
13 | 382 | 12.6 | 2435 | 11.5 | 382 | 0.3 | 2434 | 0.1 | 324 | 0.9 | 475 | 1.1 |
14 | 382 | 19.9 | 2435 | 17.7 | 382 | 0.5 | 2434 | 0.8 | 324 | 4.0 | 472 | 3.2 |
15 | 382 | 23.3 | 2435 | 20.8 | 382 | 1.6 | 2434 | 2.4 | 324 | 7.7 | 466 | 7.5 |
16 | 382 | 24.3 | 2434 | 22.8 | 382 | 4.2 | 2433 | 4.9 | 324 | 19.4 | 447 | 15.9 |
17 | 382 | 25.4 | 2432 | 23.9 | 382 | 9.7 | 2431 | 9.0 | 324 | 30.6 | 405 | 25.9 |
18 | 382 | 27.2 | 2356 | 25.3 | 382 | 13.1 | 2355 | 13.7 | 324 | 42.6 | 373 | 38.3 |
19 | 382 | 28.5 | 2192 | 26.4 | 382 | 15.2 | 2191 | 17.8 | 324 | 47.5 | 333 | 42.9 |
20 | 382 | 29.3 | 1957 | 27.3 | 382 | 18.3 | 1956 | 21.0 | 324 | 51.9 | 299 | 47.8 |
21 | 382 | 29.8 | 1651 | 28.3 | 382 | 21.2 | 1650 | 22.5 | 324 | 56.8 | 274 | 50.4 |
22 | 382 | 30.9 | 1290 | 29.5 | 382 | 24.9 | 1290 | 24.9 | 324 | 59.3 | 243 | 55.6 |
23 | 382 | 31.4 | 1015 | 31.5 | 382 | 25.7 | 1015 | 25.7 | 324 | 61.4 | 222 | 55.4 |
24 | 382 | 32.2 | 770 | 32.1 | 382 | 27.0 | 770 | 26.5 | 324 | 62.3 | 198 | 60.1 |
25 | 382 | 32.7 | 620 | 33.2 | 382 | 28.3 | 620 | 28.9 | 324 | 65.7 | 173 | 63.6 |
26 | 382 | 32.7 | 502 | 33.1 | 382 | 29.1 | 502 | 29.7 | 324 | 66.4 | 158 | 67.1 |
27 | 382 | 32.7 | 392 | 34.7 | 382 | 29.3 | 392 | 31.6 | 324 | 67.0 | 141 | 68.1 |
28 | 382 | 33.0 | 317 | 35.0 | 382 | 30.6 | 317 | 33.8 | 324 | 67.3 | 126 | 68.3 |
29 | 382 | 33.0 | 252 | 34.5 | 382 | 31.2 | 252 | 33.3 | 324 | 67.9 | 100 | 66.0 |
30 | 382 | 33.8 | 191 | 33.5 | 382 | 32.2 | 191 | 35.1 | 324 | 70.7 | 80 | 66.3 |
31 | 382 | 33.8 | 147 | 35.4 | 382 | 32.2 | 147 | 38.8 | 324 | 71.3 | 58 | 63.8 |
32 | 382 | 33.8 | 110 | 30.0 | 382 | 32.7 | 110 | 37.3 | 324 | 71.3 | ||
33 | 382 | 33.8 | 66 | 34.8 | 382 | 33.0 | 66 | 34.8 | 324 | 71.6 | ||
Accumulative incidence data based on total life span, |
Figures 113-114. Comparisons of accumulative incidence for older and younger generations: |
All curves based on total life span, irrespective of marital status. |
Table 104. Comparisons of incidences and mean frequencies of sexual activities in older and younger generations |
Educational Level and Age Group | Comparisons of
Incidences and Frequencies in Two Generations Incidences (Incid) and Mean Frequencies (Freq) for Total Population | |||||||||||||||||||||||||||||
Older Gener |
Young. Gener. | Older Gener |
Young. Gener. |
|||||||||||||||||
Older Gener. | Young. Gener. | Incid | Freq | Incid | Freq | Incid | Freq | Incid | Freq | Incid | Freq | Incid | Freq | Incid | Freq | Incid | Freq | Incid | Freq | Incid | Freq | Incid | Freq | Incid | Freq | Incid | Freq | Incid | Freq | |
Single Males | ||||||||||||||||||||||||||||||
Outlet | No. of cases | Total outlet | Masturbation |
Nocturnal emissions |
Petting to climax |
Pre-marital intercourse * |
Intercourse with prostitutes | Homosexual | ||||||||||||||||||||||
Educational Level 0-8 | ||||||||||||||||||||||||||||||
Adol.-15 | 315 | 397 |
85.4 |
2.07 |
96.0 |
3.77 |
76.8 |
1.07 |
90.9 |
1.94 |
22.9 |
0.05 |
27.5 |
0.06 |
6.7 |
0.02 |
18.6 |
0.05 |
37.1 |
0.70 |
57.4 |
1.35 |
9.8 |
0.04 |
7.8 |
0.02 |
17.1 |
0.17 |
29.0 |
0.30 |
16-20 | 346 | 374 |
96.2 |
2.31 |
98.7 |
4.05 |
78.0 |
0.78 |
90.4 |
1.08 |
55.2 |
0.13 |
57.5 |
0.17 |
13.0 |
0.03 |
28.9 |
0.08 |
74.3 |
1.20 |
87.7 |
2.39 |
51.7 |
0.23 |
44.9 |
0.17 |
17.9 |
0.16 |
33.7 |
0.27 |
21-25 | 229 | 132 |
96.1 |
2.35 |
97.7 |
4.53 |
59.4 |
0.59 |
67.4 |
0.69 |
57.6 |
0.12 |
62.9 |
0.21 |
11.4 |
0.01 |
22.7 |
0.08 |
72.5 |
1.36 |
87.9 |
3.22 |
65.5 |
0.41 |
52.3 |
0.36 |
16.6 |
0.22 |
32.6 |
0.30 |
Educational Level 9-12 | ||||||||||||||||||||||||||||||
Adol.-15 | 144 | 462 |
92.4 |
2.49 |
96.3 |
3.61 |
84.7 |
1.58 |
91.6 |
2.04 |
41.0 |
0.13 |
39.2 |
0.15 |
12.5 |
0.03 |
21.6 |
0.06 |
31.3 |
0.47 |
47.2 |
0.94 |
9.7 |
0.03 |
7.4 |
0.01 |
23.6 |
0.18 |
35.3 |
0.32 |
16-20 | 146 | 461 |
100.0 |
2.82 |
99.6 |
3.76 |
84.9 |
1.15 |
90.2 |
1.35 |
69.2 |
0.20 |
71.1 |
0.23 |
32.2 |
0.06 |
34.9 |
0.09 |
71.2 |
1.17 |
73.8 |
1.58 |
45.2 |
0.16 |
40.1 |
0.08 |
26.7 |
0.18 |
45.3 |
0.44 |
21-25 | 109 | 154 |
98.2 |
2.41 |
100.0 |
3.42 |
67.0 |
0.70 |
83.1 |
0.98 |
70.6 |
0.21 |
71.4 |
0.25 |
32.1 |
0.07 |
26.0 |
0.09 |
73.4 |
1.13 |
68.8 |
1.33 |
54.1 |
0.22 |
36.4 |
0.08 |
29.4 |
0.24 |
43.5 |
0.64 |
Educational Level 13+ | ||||||||||||||||||||||||||||||
Adol.-15 | 462 | 2337 |
95.5 |
2.76 |
95.8 |
2.84 |
80.3 |
1.97 |
82.8 |
2.27 |
72.7 |
0.44 |
69.3 |
0.32 |
9.7 |
0.03 |
14.6 |
0.05 |
9.3 |
0.12 |
9.3 |
0.07 |
1.7 |
0.00 |
2.4 |
0.00 |
25.1 |
0.14 |
20.8 |
0.08 |
16-20 | 476 | 2385 |
99.8 |
2.69 |
99.7 |
2.70 |
85.7 |
1.71 |
89.2 |
1.81 |
92.2 |
0.49 |
91.0 |
0.41 |
39.3 |
0.11 |
47.1 |
0.15 |
37.0 |
0.28 |
39.2 |
0.27 |
18.7 |
0.03 |
19.4 |
0.02 |
16.4 |
0.09 |
15.9 |
0.06 |
21-25 | 456 | 1442 |
99.6 |
2.57 |
99.9 |
2.47 |
83.6 |
1.30 |
88.1 |
1.31 |
90.1 |
0.41 |
86.1 |
0.38 |
51.8 |
0.18 |
51.9 |
0.18 |
56.4 |
0.58 |
54.1 |
0.45 |
23.7 |
0.07 |
15.1 |
0.02 |
12.7 |
0.10 |
8.5 |
0.09 |
26-30 | 269 | 218 |
99.6 |
2.68 |
100.0 |
2.43 |
81.0 |
1.24 |
85.8 |
1.09 |
86.6 |
0.34 |
83.5 |
0.27 |
46.1 |
0.12 |
42.7 |
0.15 |
59.9 |
0.81 |
55.5 |
0.62 |
20.4 |
0.11 |
11.5 |
0.05 |
16.4 |
0.20 |
18.3 |
0.26 |
Married Males | ||||||||||||||||||||||||||||||
Outlet | No. of cases | Total outlet | Marital intercourse |
Extra-marital intercourse |
||||||||||||||||||||||||||
Educational Level 0-8 | ||||||||||||||||||||||||||||||
16-20 | 75 | 83 |
100.0 |
3.75 |
100.0 |
5.50 |
100.0 |
3.07 |
100.0 |
4.35 |
32.0 |
0.37 |
55.4 |
0.69 | ||||||||||||||||
21-25 | 204 | 120 |
100.0 |
3.08 |
100.0 |
5.61 |
99.5 |
2.70 |
99.2 |
4.28 |
27.9 |
0.19 |
45.0 |
1.04 | ||||||||||||||||
26-30 | 227 | 65 |
100.0 |
3.02 |
96.9 |
5.22 |
100.0 |
2.65 |
96.9 |
4.21 |
32.2 |
0.16 |
44.6 |
0.61 | ||||||||||||||||
Educational Level 9-12 | ||||||||||||||||||||||||||||||
21-25 | 71 | 93 |
100.0 |
3.89 |
100.0 |
4.35 |
100.0 |
3.24 |
100.0 |
3.43 |
36.6 |
0.37 |
46.2 |
0.50 | ||||||||||||||||
26-30 | 83 | 52 |
100.0 |
3.43 |
100.0 |
3.76 |
100.0 |
2.76 |
100.0 |
3.07 |
38.6 |
0.32 |
53.8 |
0.32 | ||||||||||||||||
Educational Level 13+ | ||||||||||||||||||||||||||||||
21-25 | 144 | 296 |
100.0 |
3.86 |
100.0 |
3.62 |
98.6 |
3.25 |
100.0 |
2.98 |
18.8 |
0.16 |
13.2 |
0.04 | ||||||||||||||||
26-30 | 317 | 215 |
100.0 |
3.33 |
100.0 |
2.99 |
99.1 |
2.76 |
99.5 |
2.40 |
24.3 |
0.12 |
18.1 |
0.05 | ||||||||||||||||
“Educ. level 0-8” are the males who never go beyond grade school. |
||||||||||||||||||||||||||||||
* Under Pre-marital Intercourse, mean frequencies are given for total pre-marital intercourse and incidences for intercourse with companioins. | ||||||||||||||||||||||||||||||
Median difference of age between the two groups is 22 years. |
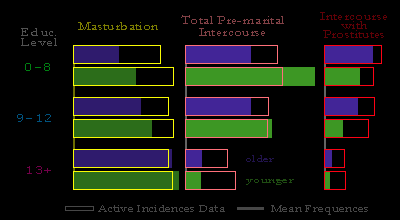
Figures 122,123. Comparisons of
active incidences data and frequencies of sexual activity |
Active incidence data are given in lined borders. |
Comparisons of active incidences data and mean frequencies for males 16-20 years of age, showing data |